OPEN-SOURCE SCRIPT
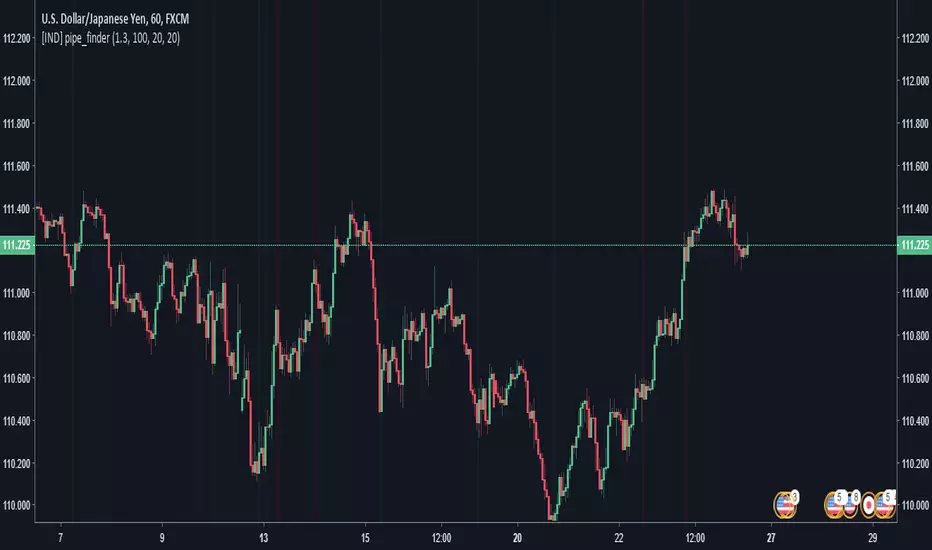
pipe_finder. Reversal Indicator for Pipe Top & Bottom Patterns.

Simple indicator to find pipe bottom and top patterns.
Definition:
- Pipe Bottom:
- Positive Difference from Open and Close is greater than the average thickness of the last "x" candles multiplied by sensitivity "y"
- The previous candle is red and the current candle is green
- Trend Definition - (Trend for EMA length 'z" has a slope less than 0 or pointed downwards)
- The average of the current and previous candle's volume is greater than the average volume for the last "n" candles.
- Pipe Top:
- Positive Difference from Open and Close is greater than the average thickness of the last "x" candles multiplied by sensitivity "y"
- The previous candle is green and the current candle is red
- Trend Definition - (Trend for EMA length 'z" has a slope greater than 0 or pointed upwards)
- The average of the current and previous candle's volume is greater than the average volume for the last "n" candles.
Settings:
Sensitivity: How thick do the pipe candles have to be? (Greater sensitivity = more alerts)
Candle Thickness Average Period: The number of past candles used for measuring the average body size of candlestick.
Filter EMA Length: Length of the EMA used to filter between bull trends and bear trends.
Volume EMA Length: Length of the volume EMA.
סקריפט קוד פתוח
ברוח האמיתית של TradingView, יוצר הסקריפט הזה הפך אותו לקוד פתוח, כך שסוחרים יוכלו לעיין בו ולאמת את פעולתו. כל הכבוד למחבר! אמנם ניתן להשתמש בו בחינם, אך זכור כי פרסום חוזר של הקוד כפוף ל־כללי הבית שלנו.
כתב ויתור
המידע והפרסומים אינם מיועדים להיות, ואינם מהווים, ייעוץ או המלצה פיננסית, השקעתית, מסחרית או מכל סוג אחר המסופקת או מאושרת על ידי TradingView. קרא עוד ב־תנאי השימוש.