OPEN-SOURCE SCRIPT
Drawdown Visualisation
█ OVERVIEW
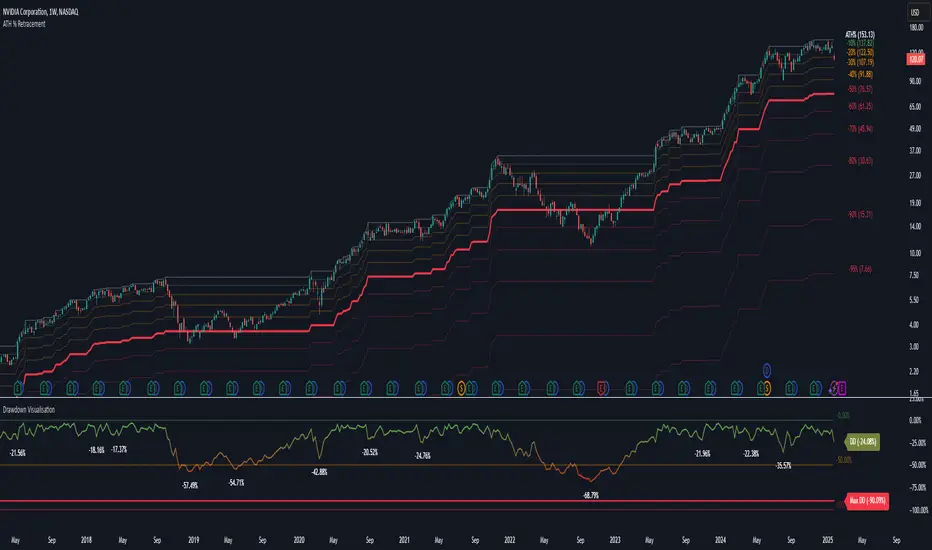
The Drawdown Visualisation indicator calculates and displays the instrument’s drawdown (in percent) relative to its all‐time high (ATH) from a user‐defined start date. It provides customisable options for label appearance, threshold lines (0%, –50%, –100%), and can plot historic drawdown levels via pivot detection.
█ USAGE
This indicator should be used with the Percentage Retracement from ATH indicator.
█ KEY FEATURES
█ PURPOSE
█ IDEAL USERS
The Drawdown Visualisation indicator calculates and displays the instrument’s drawdown (in percent) relative to its all‐time high (ATH) from a user‐defined start date. It provides customisable options for label appearance, threshold lines (0%, –50%, –100%), and can plot historic drawdown levels via pivot detection.
█ USAGE
This indicator should be used with the Percentage Retracement from ATH indicator.
█ KEY FEATURES
- Custom Date Settings — Use a custom start date so that only specified price action is considered.
- Retracement Level Calculation — Determines ATH and computes multiple retracement levels using percentages from 0% to –100%.
- Visual Signals and Customisation — Plots configurable horizontal lines and labels that display retracement percentages and prices.
- Time Filtering — Bases calculations on data from the desired time period.
Historic Drawdowns — Display historical drawdowns
█ PURPOSE
- Assist traders in visualising the depth of price retracements from recent or historical peaks.
- Identify critical zones where the market may find support or resistance after reaching an ATH.
- Facilitate more informed entry and exit decisions by clearly demarcating retracement levels on the chart.
█ IDEAL USERS
- Swing Traders — Looking to exploit pullbacks following strong upward moves.
- Technical Analysts — Interested in pinpointing key retracement levels as potential reversal or continuation points.
- Price Action Traders — Focused on the nuances of market peaks and subsequent corrections.
- Strategy Developers — Keen to backtest and refine approaches centred on retracement dynamics.
סקריפט קוד פתוח
ברוח האמיתית של TradingView, יוצר הסקריפט הזה הפך אותו לקוד פתוח, כך שסוחרים יוכלו לעיין בו ולאמת את פעולתו. כל הכבוד למחבר! אמנם ניתן להשתמש בו בחינם, אך זכור כי פרסום חוזר של הקוד כפוף ל־כללי הבית שלנו.
כתב ויתור
המידע והפרסומים אינם מיועדים להיות, ואינם מהווים, ייעוץ או המלצה פיננסית, השקעתית, מסחרית או מכל סוג אחר המסופקת או מאושרת על ידי TradingView. קרא עוד ב־תנאי השימוש.