OPEN-SOURCE SCRIPT
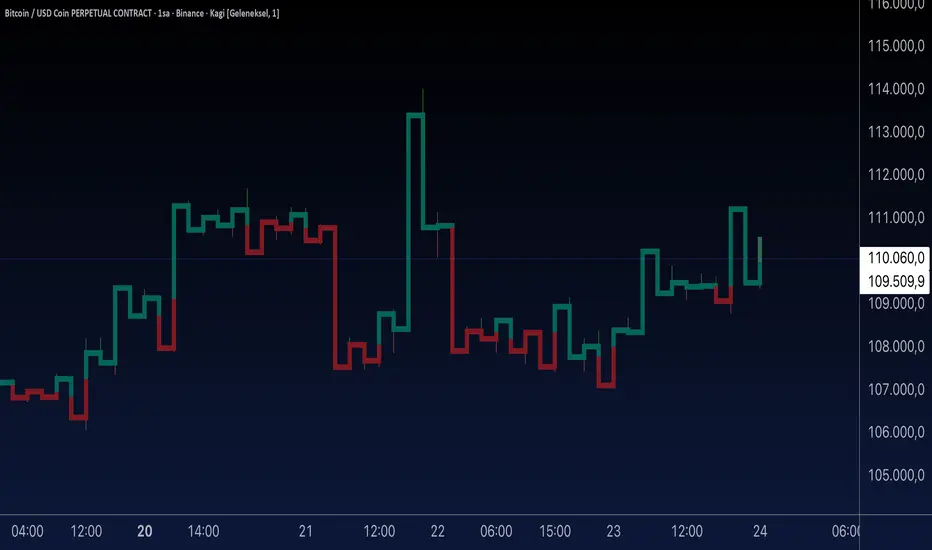
Aynet- True Wick Projector for Non-Standard Charts
Technical Explanation: "Data Projection and Synchronization"
This script is, at its core, a "data projection" tool. The fundamental technical problem it solves is compensating for the information loss that occurs when using different data visualization models.
1. The Core Problem: Information Loss
Standard Charts (Time-Based): Normal candlesticks are time-based. Each candle represents a fixed time interval (like 1 hour or 1 day) and displays the complete Open, High, Low, and Close (OHLC) data for that period. The "wicks" show the volatility and the extreme price points (the High and Low).
Non-Standard Charts (Price/Momentum-Based): Charts like Kagi, Renko, or Line Break filter out time. Their only concern is price movement. While one Renko box or Kagi line is forming, 10 or more time-based candles might have formed in the background. During this "noise filtering" process, the true high and low values (the wicks) from those underlying candles are lost.
The problem is this: A trader looking at a non-standard chart cannot see how high or low the price actually went while that block or line was forming. This is a critical loss of information regarding market volatility, support/resistance levels, and price rejection.
2. The Technical Solution: A "Dual Data Stream"
This script intelligently combines two different data streams to compensate for this information loss:
Main Stream (Current Chart): The open and close data from your active Kagi, Renko, etc., chart.
Secondary Stream (Projected Data): The high and low data from the underlying standard (time-based) chart.
3. The Code's Methodical Steps
Step 1: Identifying the Data Source (syminfo...)
This step precisely identifies the source for the secondary data stream. By using syminfo.prefix + ":" + syminfo.ticker (e.g., "NASDAQ:AAPL"), it guarantees that the data is pulled from the exact correct instrument and exchange.
Step 2: Data Request & "Lookahead" Synchronization (request.security)
This is the most critical part of the operation.
request.security(...): This is the function Pine Script uses to pull data from another dataset (the secondary stream) onto the current chart.
[high, low]: This tells the function, "The only data I care about is the 'High' and 'Low' of the standard candle from that timeframe."
lookahead = barmerge.lookahead_on (The Critical Key): This command solves the "time paradox."
Normally (without this): request.security fetches data from the last completed bar. But as your Kagi bar is currently forming, the standard candle is also currently forming. This would cause the data to always be one bar behind (lag).
With lookahead_on: This permits the script to "look ahead" at the data from the currently forming, incomplete standard bar. Because of this, as your Kagi bar moves, the true wick data is updated in real-time. This achieves real-time synchronization.
Step 3: Visual Engineering (plotcandle)
After the script retrieves the data, it must "draw" it. However, it only wants to draw the wicks, not the candle bodies.
bodyTop and bodyBottom: First, it finds the top and bottom of the current Kagi bar's body (using math.max(open, close)).
Plotting the Upper Wick (Green):
It calls the plotcandle function and instructs it to draw a fake candle.
It fixes this fake candle's Open, Low, and Close (open, low, close) values to the top of the Kagi bar's body (bodyTop).
It only sets the High (high) value to the realHigh it fetched with request.security.
The result: A wick is drawn from the bodyTop level up to the realHigh level, with no visible body.
Plotting the Lower Wick (Red):
It applies the reverse logic.
It fixes the fake candle's Open, High, and Close values to the bottom of the Kagi bar's body (bodyBottom).
It only sets the Low (low) value to the realLow.
The result: A lower wick is drawn from bodyBottom down to realLow.
Invisibility (color.new(color.white, 100)):
In both plotcandle calls, the color (body color) and bordercolor are set to 100 transparency. This makes the "fake" candle bodies completely invisible, leaving only the colored wicks.
Conclusion (Technical Summary)
This script reclaims the volatility data (the wicks) that is naturally sacrificed by non-standard charts.
It achieves this with technical precision by creating a secondary data stream using request.security and synchronizing it with zero lag using the lookahead_on parameter.
Finally, it intelligently manipulates the plotcandle function (by creating invisible bodies) to project this lost data onto your Kagi/Renko chart as an "augmented reality" layer. This allows a trader to benefit from the clean, noise-filtered view of a non-standard chart without losing access to the full picture of market volatility.
סקריפט קוד פתוח
ברוח האמיתית של TradingView, יוצר הסקריפט הזה הפך אותו לקוד פתוח, כך שסוחרים יוכלו לעיין בו ולאמת את פעולתו. כל הכבוד למחבר! אמנם ניתן להשתמש בו בחינם, אך זכור כי פרסום חוזר של הקוד כפוף ל־כללי הבית שלנו.
כתב ויתור
המידע והפרסומים אינם מיועדים להיות, ואינם מהווים, ייעוץ או המלצה פיננסית, השקעתית, מסחרית או מכל סוג אחר המסופקת או מאושרת על ידי TradingView. קרא עוד ב־תנאי השימוש.