OPEN-SOURCE SCRIPT
Double CCI

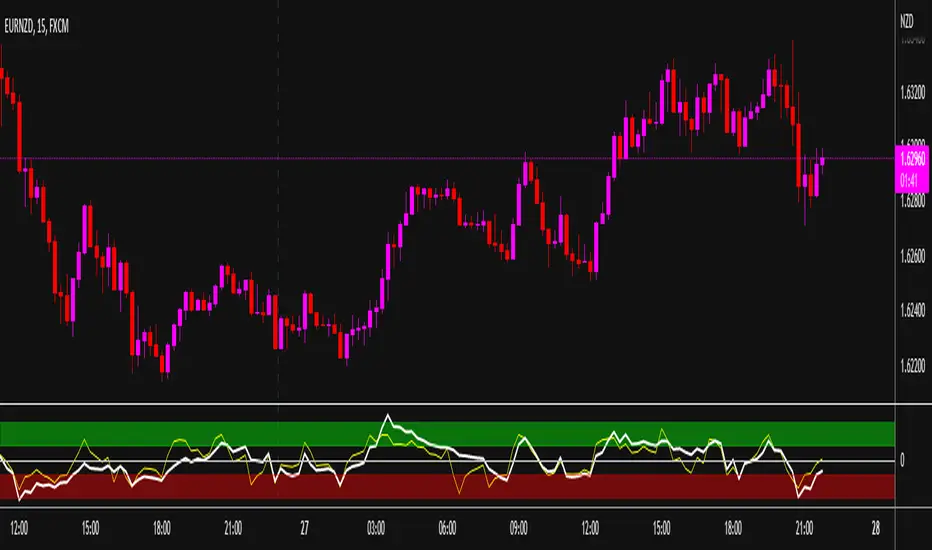
With this variant of the CCI indicator you have 2 CCIs. I call it convenience the fast and the slow.
The slow one has the default period of 20. The fast one has a lower value and will therefore also change his direction much faster.
I don't use this as a decisive indicator, but the fast one does indicate where the standard CCI might go and so you are already prepared for the decisive moment.
I've added a zero line so you can visually track whether the buyers or the sellers are predominant.
Between 0 and +100, as well as between 0 and -100 there is still a battle between buyers and sellers and it is better to wait a little longer before entering a trade.
From +100 to +250 I have colored the zone green; here the buyers are winning and it is a confirmation that you can safer enter the BUY.
From -100 to -250 it's colored red; here the sellers are firmly winning and it is a confirmation to go into a SELL.
Most values are adjustable via the settings and can be switched on or off.
This indicator is not intended to be used as the sole decision element, but rather to fine-tune your entry and exit points. Maybe wait a little longer than you normally would, but then be able to step in at the right time that there is enough volume in your desired direction.
Good luck with it and I would love feedback.
Thank you Tradingview-community.
סקריפט קוד פתוח
ברוח האמיתית של TradingView, יוצר הסקריפט הזה הפך אותו לקוד פתוח, כך שסוחרים יוכלו לעיין בו ולאמת את פעולתו. כל הכבוד למחבר! אמנם ניתן להשתמש בו בחינם, אך זכור כי פרסום חוזר של הקוד כפוף ל־כללי הבית שלנו.
כתב ויתור
המידע והפרסומים אינם מיועדים להיות, ואינם מהווים, ייעוץ או המלצה פיננסית, השקעתית, מסחרית או מכל סוג אחר המסופקת או מאושרת על ידי TradingView. קרא עוד ב־תנאי השימוש.