OPEN-SOURCE SCRIPT
מעודכן Script Stopwatch - PineCoders FAQ

█ WARNING
The publication of our LibraryStopwatch has deprecated this publication.
█ ORIGINAL DESCRIPTION
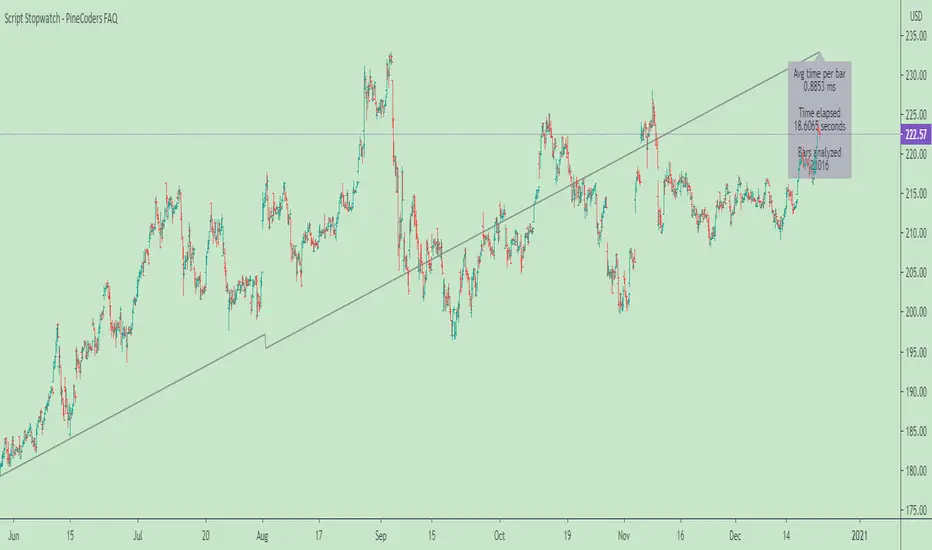
This script calculates the run time of a Pine script. While its numbers are not very precise and it doesn’t work on all scripts, it will help developers calculate run times more precisely than by hand, and so provides Pine coders with an additional profiling tool to help them optimize their code.
How to use the code
• Place the code included between the up/down arrows after your script’s input() calls.
• Comment out the display modes you don’t want to use.
• Save your script, wait and look at the results.
• Results show in different colors, depending on the average time per bar:
- green for < 5 ms
- dark red for < 50 ms
- bright red for > 50 ms (the maximum allowed is 200).
How the code works
The code in this script starts by saving the value of the timenow variable on the first bar. While the time variable returns the time at the beginning of the bar, timenow returns the current time. The code then follows the progression of timenow during the script’s execution. The variable only updates every second, so in between updates the script makes an estimate of the total time elapsed by adding the last average time per bar calculated to each bar that passes until timenow increases by another 1000 because one more second has elapsed since its last update. At that point a new, current average time per bar is calculated and the cycle repeats.
The code only calculates elapsed time for the initial run. Once the realtime bar is hit, timing stops so that time spent in the realtime bar does not affect the numbers once they have been calculated on the script’s initial pass over the dataset.
Notes
• If results show zero elapsed time, it’s most probably because your script executes in less than one second, which is very good. In that case timenow hasn’t changed, so no timing can be calculated.
• The code is quirky and doesn’t work on all scripts.
• It doesn’t properly time execution of security() calls.
• The average time per bar will sometimes vary quite a bit with changes in chart resolution.
Look first. Then leap.
הערות שחרור
Updated comments.הערות שחרור
More efficient label code.הערות שחרור
Added a plot at the end to force timing of the script.סקריפט קוד פתוח
ברוח האמיתית של TradingView, יוצר הסקריפט הזה הפך אותו לקוד פתוח, כך שסוחרים יוכלו לעיין בו ולאמת את פעולתו. כל הכבוד למחבר! אמנם ניתן להשתמש בו בחינם, אך זכור כי פרסום חוזר של הקוד כפוף ל־כללי הבית שלנו.
Who are PineCoders? tradingview.com/chart/SSP/yW5eOqtm-Who-are-PineCoders/
Tools and ideas for all Pine coders: pinecoders.com
Tools and ideas for all Pine coders: pinecoders.com
כתב ויתור
המידע והפרסומים אינם מיועדים להיות, ואינם מהווים, ייעוץ או המלצה פיננסית, השקעתית, מסחרית או מכל סוג אחר המסופקת או מאושרת על ידי TradingView. קרא עוד ב־תנאי השימוש.
סקריפט קוד פתוח
ברוח האמיתית של TradingView, יוצר הסקריפט הזה הפך אותו לקוד פתוח, כך שסוחרים יוכלו לעיין בו ולאמת את פעולתו. כל הכבוד למחבר! אמנם ניתן להשתמש בו בחינם, אך זכור כי פרסום חוזר של הקוד כפוף ל־כללי הבית שלנו.
Who are PineCoders? tradingview.com/chart/SSP/yW5eOqtm-Who-are-PineCoders/
Tools and ideas for all Pine coders: pinecoders.com
Tools and ideas for all Pine coders: pinecoders.com
כתב ויתור
המידע והפרסומים אינם מיועדים להיות, ואינם מהווים, ייעוץ או המלצה פיננסית, השקעתית, מסחרית או מכל סוג אחר המסופקת או מאושרת על ידי TradingView. קרא עוד ב־תנאי השימוש.