OPEN-SOURCE SCRIPT
Bitcoin MVRV Z-Score Indicator
### **What This Script Does (In Plain English)**
Imagine Bitcoin has a "fair price" based on what people *actually paid* for it (called the **Realized Value**). This script tells you if Bitcoin is currently **overpriced** or **underpriced** compared to that fair price, using math.
---
### **How It Works (Like a Car Dashboard)**
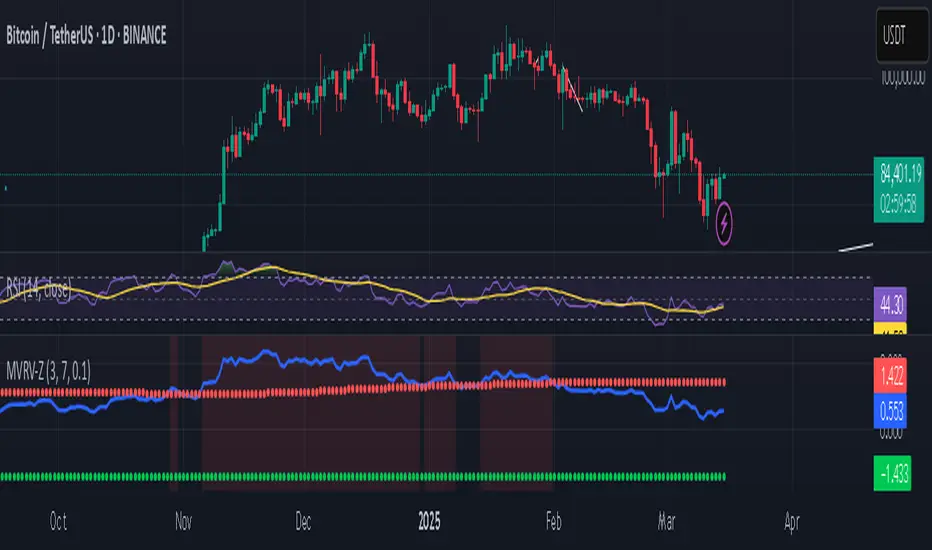
1. **The Speedometer (Z-Score Line)**
- The blue line (**Z-Score**) acts like a speedometer for Bitcoin’s price:
- **Above Red Line** → Bitcoin is "speeding" (overpriced).
- **Below Green Line** → Bitcoin is "parked" (underpriced).
2. **The Warning Lights (Colors)**
- **Red Background**: "Slow down!" – Bitcoin might be too expensive.
- **Green Background**: "Time to fuel up!" – Bitcoin might be a bargain.
3. **The Alarms (Alerts)**
- Your phone buzzes when:
- Green light turns on → "Buy opportunity!"
- Red light turns on → "Be careful – might be time to sell!"
---
### **Real-Life Example**
- **2021 Bitcoin Crash**:
- The red light turned on when Bitcoin hit $60,000+ (Z-Score >7).
- A few months later, Bitcoin crashed to $30,000.
- **2023 Rally**:
- The green light turned on when Bitcoin was around $20,000 (Z-Score <0.1).
- Bitcoin later rallied to $35,000.
---
### **How to Use It (3 Simple Steps)**
1. **Look at the Blue Line**:
- If it’s **rising toward the red zone**, Bitcoin is getting expensive.
- If it’s **falling toward the green zone**, Bitcoin is getting cheap.
2. **Check the Colors**:
- Trade carefully when the background is **red**.
- Look for buying chances when it’s **green**.
3. **Set Alerts**:
- Get notified when Bitcoin enters "cheap" or "expensive" zones.
---
### **Important Notes**
- **Not Magic**: This tool helps spot trends but isn’t perfect. Always combine it with other indicators.
- **Best for Bitcoin**: Works great for Bitcoin, not as well for altcoins.
- **Long-Term Focus**: Signals work best over months/years, not hours.
---
Think of it as a **thermometer for Bitcoin’s price fever** – it tells you when the market is "hot" or "cold." 🔥❄️
Imagine Bitcoin has a "fair price" based on what people *actually paid* for it (called the **Realized Value**). This script tells you if Bitcoin is currently **overpriced** or **underpriced** compared to that fair price, using math.
---
### **How It Works (Like a Car Dashboard)**
1. **The Speedometer (Z-Score Line)**
- The blue line (**Z-Score**) acts like a speedometer for Bitcoin’s price:
- **Above Red Line** → Bitcoin is "speeding" (overpriced).
- **Below Green Line** → Bitcoin is "parked" (underpriced).
2. **The Warning Lights (Colors)**
- **Red Background**: "Slow down!" – Bitcoin might be too expensive.
- **Green Background**: "Time to fuel up!" – Bitcoin might be a bargain.
3. **The Alarms (Alerts)**
- Your phone buzzes when:
- Green light turns on → "Buy opportunity!"
- Red light turns on → "Be careful – might be time to sell!"
---
### **Real-Life Example**
- **2021 Bitcoin Crash**:
- The red light turned on when Bitcoin hit $60,000+ (Z-Score >7).
- A few months later, Bitcoin crashed to $30,000.
- **2023 Rally**:
- The green light turned on when Bitcoin was around $20,000 (Z-Score <0.1).
- Bitcoin later rallied to $35,000.
---
### **How to Use It (3 Simple Steps)**
1. **Look at the Blue Line**:
- If it’s **rising toward the red zone**, Bitcoin is getting expensive.
- If it’s **falling toward the green zone**, Bitcoin is getting cheap.
2. **Check the Colors**:
- Trade carefully when the background is **red**.
- Look for buying chances when it’s **green**.
3. **Set Alerts**:
- Get notified when Bitcoin enters "cheap" or "expensive" zones.
---
### **Important Notes**
- **Not Magic**: This tool helps spot trends but isn’t perfect. Always combine it with other indicators.
- **Best for Bitcoin**: Works great for Bitcoin, not as well for altcoins.
- **Long-Term Focus**: Signals work best over months/years, not hours.
---
Think of it as a **thermometer for Bitcoin’s price fever** – it tells you when the market is "hot" or "cold." 🔥❄️
סקריפט קוד פתוח
ברוח האמיתית של TradingView, יוצר הסקריפט הזה הפך אותו לקוד פתוח, כך שסוחרים יוכלו לעיין בו ולאמת את פעולתו. כל הכבוד למחבר! אמנם ניתן להשתמש בו בחינם, אך זכור כי פרסום חוזר של הקוד כפוף ל־כללי הבית שלנו.
כתב ויתור
המידע והפרסומים אינם מיועדים להיות, ואינם מהווים, ייעוץ או המלצה פיננסית, השקעתית, מסחרית או מכל סוג אחר המסופקת או מאושרת על ידי TradingView. קרא עוד ב־תנאי השימוש.