PINE LIBRARY
מעודכן CreateAndShowZigzag

Library "CreateAndShowZigzag"
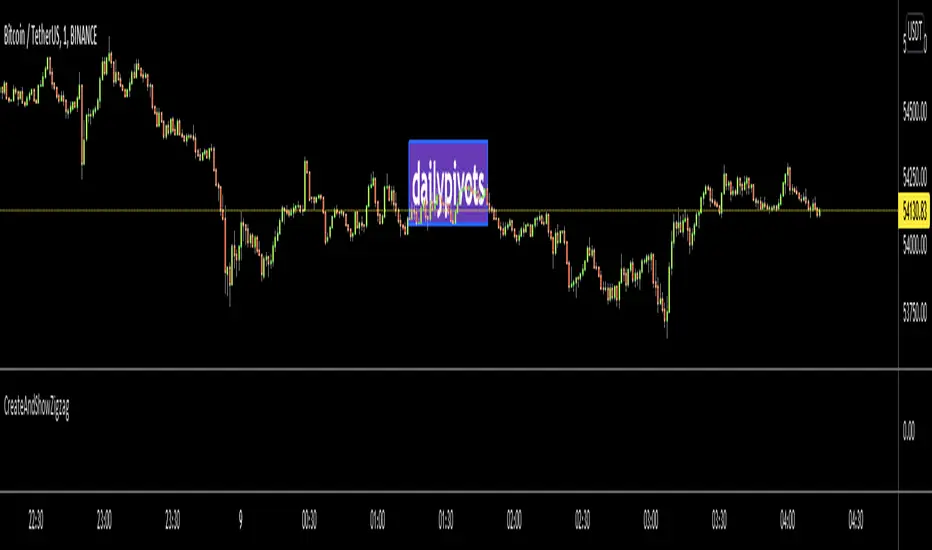
Functions in this library creates/updates zigzag array and shows the zigzag
getZigzag(zigzag, prd, max_array_size) calculates zigzag using period
Parameters:
Returns: dir that is the current direction of the zigzag
showZigzag(zigzag, oldzigzag, dir, upcol, dncol) this function shows zigzag
Parameters:
Returns: null
Functions in this library creates/updates zigzag array and shows the zigzag
getZigzag(zigzag, prd, max_array_size) calculates zigzag using period
Parameters:
- zigzag: is the float array for the zigzag (should be defined like "var zigzag = array.new_float(0)"). each zigzag points contains 2 element: 1. price level of the zz point 2. bar_index of the zz point
- prd: is the length to calculate zigzag waves by highest(prd)/lowest(prd)
- max_array_size: is the maximum number of elements in zigzag, keep in mind each zigzag point contains 2 elements, so for example if it's 10 then zigzag has 10/2 => 5 zigzag points
Returns: dir that is the current direction of the zigzag
showZigzag(zigzag, oldzigzag, dir, upcol, dncol) this function shows zigzag
Parameters:
- zigzag: is the float array for the zigzag (should be defined like "var zigzag = array.new_float(0)"). each zigzag points contains 2 element: 1. price level of the zz point 2. bar_index of the zz point
- oldzigzag: is the float array for the zigzag, you get copy the zigzag array to oldzigzag by "oldzigzag = array.copy(zigzay)" before calling get_zigzag() function
- dir: is the direction of the zigzag wave
- upcol: is the color of the line if zigzag direction is up
- dncol: is the color of the line if zigzag direction is down
Returns: null
הערות שחרור
updatedהערות שחרור
v3הערות שחרור
v4ספריית Pine
ברוח האמיתית של TradingView, המחבר לפרסם את הקוד של Pine הזה כספרייה בקוד פתוח, כך שמתכנתים אחרים בקהילתנו יעשו שימוש חוזר. כל הכבוד למחבר! ניתן להשתמש בספרייה הזו באופן פרטי או בומים בקוד פתוח, אך השימוש בחוזר בקוד הזה בפרסומים כפוף ל-כללי הבית.
Official Telegram Channel: t.me/LonesomeTheBlue_Official
You can get monthly subscription to my Pro indicators. Please visit my "LTB Professional Trading Suite" for more info
You can get monthly subscription to my Pro indicators. Please visit my "LTB Professional Trading Suite" for more info
כתב ויתור
המידע והפרסומים אינם מיועדים להיות, ואינם מהווים, ייעוץ או המלצה פיננסית, השקעתית, מסחרית או מכל סוג אחר המסופקת או מאושרת על ידי TradingView. קרא עוד ב־תנאי השימוש.
ספריית Pine
ברוח האמיתית של TradingView, המחבר לפרסם את הקוד של Pine הזה כספרייה בקוד פתוח, כך שמתכנתים אחרים בקהילתנו יעשו שימוש חוזר. כל הכבוד למחבר! ניתן להשתמש בספרייה הזו באופן פרטי או בומים בקוד פתוח, אך השימוש בחוזר בקוד הזה בפרסומים כפוף ל-כללי הבית.
Official Telegram Channel: t.me/LonesomeTheBlue_Official
You can get monthly subscription to my Pro indicators. Please visit my "LTB Professional Trading Suite" for more info
You can get monthly subscription to my Pro indicators. Please visit my "LTB Professional Trading Suite" for more info
כתב ויתור
המידע והפרסומים אינם מיועדים להיות, ואינם מהווים, ייעוץ או המלצה פיננסית, השקעתית, מסחרית או מכל סוג אחר המסופקת או מאושרת על ידי TradingView. קרא עוד ב־תנאי השימוש.