OPEN-SOURCE SCRIPT
BB - MFI/RSI [Modified from LazyBear]
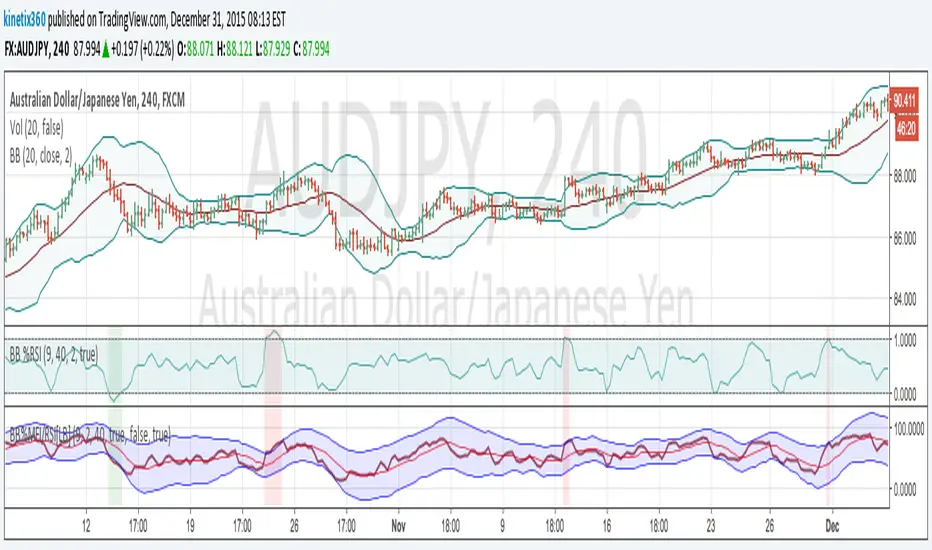
Here is the modification from BB-MFI/RSI from LazyBear. I add the period for the BB as told by John Bollinger in his book.
Base on his book, he suggest to try :
9p RSI with 40p BB and Stdv 2.0
14p RSI with 50p BB and Stdv 2.1
10p MFI with 40p BB and Stdv 2.0
The idea is to compare the short period in indicator with Long period of BB.
Base on his book, he suggest to try :
9p RSI with 40p BB and Stdv 2.0
14p RSI with 50p BB and Stdv 2.1
10p MFI with 40p BB and Stdv 2.0
The idea is to compare the short period in indicator with Long period of BB.
סקריפט קוד פתוח
ברוח TradingView אמיתית, היוצר של הסקריפט הזה הפך אותו לקוד פתוח, כך שסוחרים יכולים לבדוק ולאמת את הפונקציונליות שלו. כל הכבוד למחבר! למרות שאתה יכול להשתמש בו בחינם, זכור שפרסום מחדש של הקוד כפוף לכללי הבית שלנו.
כתב ויתור
המידע והפרסומים אינם אמורים להיות, ואינם מהווים, עצות פיננסיות, השקעות, מסחר או סוגים אחרים של עצות או המלצות שסופקו או מאושרים על ידי TradingView. קרא עוד בתנאים וההגבלות.