PROTECTED SOURCE SCRIPT
Alt Chart Divergence
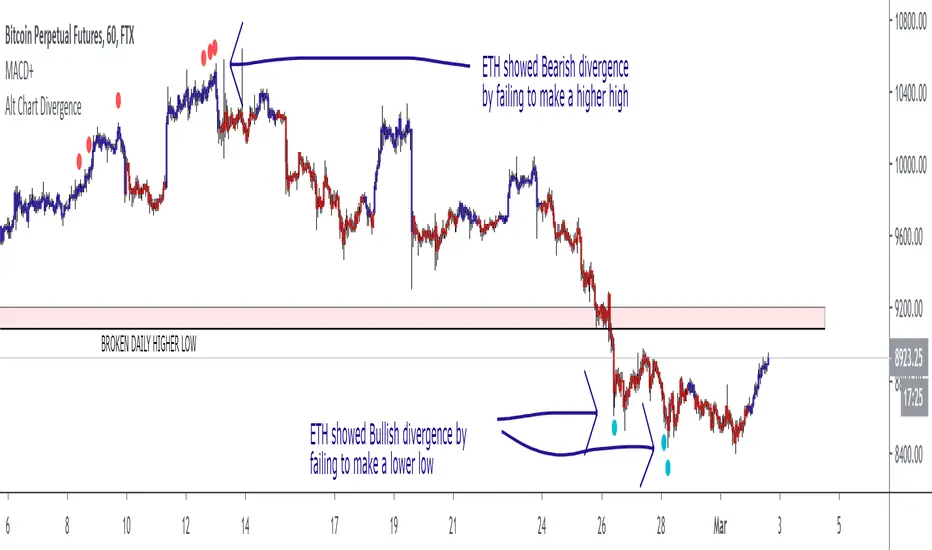
This script is designed to allow you to view bullish or bearish divergences between Bitcoin and ETH or an other alt of choice. However, you could also apply the idea in reverse or use it to look at chart comparisons such as DJI vs SPX or XAU vs XAG or UKOIL vs USOIL. Any alternate ticker can be used to plot divergences on the primary ticker treating the alternate chart as an indicator.
The design is very simple, just showing a dot for each case of bullish or bearish divergence.
The design is very simple, just showing a dot for each case of bullish or bearish divergence.
סקריפט מוגן
סקריפט זה פורסם כמקור סגור. עם זאת, תוכל להשתמש בו בחופשיות וללא כל מגבלות – למד עוד כאן
כתב ויתור
המידע והפרסומים אינם מיועדים להיות, ואינם מהווים, ייעוץ או המלצה פיננסית, השקעתית, מסחרית או מכל סוג אחר המסופקת או מאושרת על ידי TradingView. קרא עוד ב־תנאי השימוש.
סקריפט מוגן
סקריפט זה פורסם כמקור סגור. עם זאת, תוכל להשתמש בו בחופשיות וללא כל מגבלות – למד עוד כאן
כתב ויתור
המידע והפרסומים אינם מיועדים להיות, ואינם מהווים, ייעוץ או המלצה פיננסית, השקעתית, מסחרית או מכל סוג אחר המסופקת או מאושרת על ידי TradingView. קרא עוד ב־תנאי השימוש.