OPEN-SOURCE SCRIPT
Efficiency Ratio (Market Noise) by Alejandro P
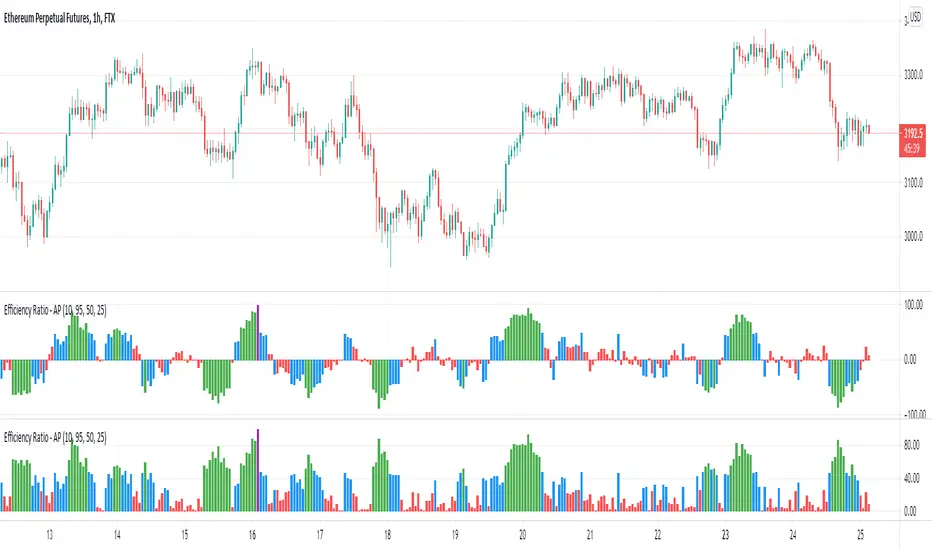
This is an indicator based on the Efficiency Ratio by Perry Kaufman. Like Price Density, which we have published previously, Perry Kaufman's Efficiency Ratio is a quantifiable method of measuring market noise.
This version of the indicator includes a feature to make the values of the indicator change based on thresholds to easier visualize different market conditions. Additionally there is a directional feature which factors in the direction of the price moves.
We can use the Efficiency Ratio to set rules and only trade particular systems when noise is at an appropriate level. For example, if noise is high then we would want to avoid trend following strategies and instead trade mean-reversion strategies, and vice-versa when the opposite is true.
The Efficiency Ratio can also be used to match assets to strategies. Some assets will be naturally more noisy than others and therefore we might have a principle where we only trade those noisy assets with our mean reversion strategies and the more quiet assets with trend following strategies.
Calculation:
Efficiency Ratio = Absolute net change in close price / absolute sum of the individual close price changes
The numerator looks at the absolute close change in price. It subtracts the starting close price in the period from the final close price in the period. The denominator compares the close price of one bar to the close price of the previous bar, this is performed for each of the successive bars in the whole period and then the value is summed. The absolute price is used because there are positive and negative values because each bar may close above or below the previous bar close.
The Efficiency Ratio provides an opposite interpretation of market noise compared to Price Density. With Price Density high values = high noise and low values = low noise. With the Efficiency Ratio high values = low noise and low values = high noise.
Comparing Price Density to Perry Kaufman's Efficiency Ratio:
Similarities
Differences
Full credits to the source of the above information and interpretation.
This version of the indicator includes a feature to make the values of the indicator change based on thresholds to easier visualize different market conditions. Additionally there is a directional feature which factors in the direction of the price moves.
We can use the Efficiency Ratio to set rules and only trade particular systems when noise is at an appropriate level. For example, if noise is high then we would want to avoid trend following strategies and instead trade mean-reversion strategies, and vice-versa when the opposite is true.
The Efficiency Ratio can also be used to match assets to strategies. Some assets will be naturally more noisy than others and therefore we might have a principle where we only trade those noisy assets with our mean reversion strategies and the more quiet assets with trend following strategies.
Calculation:
Efficiency Ratio = Absolute net change in close price / absolute sum of the individual close price changes
The numerator looks at the absolute close change in price. It subtracts the starting close price in the period from the final close price in the period. The denominator compares the close price of one bar to the close price of the previous bar, this is performed for each of the successive bars in the whole period and then the value is summed. The absolute price is used because there are positive and negative values because each bar may close above or below the previous bar close.
The Efficiency Ratio provides an opposite interpretation of market noise compared to Price Density. With Price Density high values = high noise and low values = low noise. With the Efficiency Ratio high values = low noise and low values = high noise.
Comparing Price Density to Perry Kaufman's Efficiency Ratio:
Similarities
- Both use the sum of the individual bar moves
- - Price Density - High - Low
- - Efficiency Ratio - Close to Close
Differences
- Price Density uses the full price range (to determine the height of the box)
- Efficiency Ratio uses the net close price change over the period
- The interpretation of the values is the reverse for each
Full credits to the source of the above information and interpretation.
סקריפט קוד פתוח
ברוח האמיתית של TradingView, יוצר הסקריפט הזה הפך אותו לקוד פתוח, כך שסוחרים יוכלו לעיין בו ולאמת את פעולתו. כל הכבוד למחבר! אמנם ניתן להשתמש בו בחינם, אך זכור כי פרסום חוזר של הקוד כפוף ל־כללי הבית שלנו.
כתב ויתור
המידע והפרסומים אינם מיועדים להיות, ואינם מהווים, ייעוץ או המלצה פיננסית, השקעתית, מסחרית או מכל סוג אחר המסופקת או מאושרת על ידי TradingView. קרא עוד ב־תנאי השימוש.