OPEN-SOURCE SCRIPT
Vertical & Open Lines - Yearly [MsF]
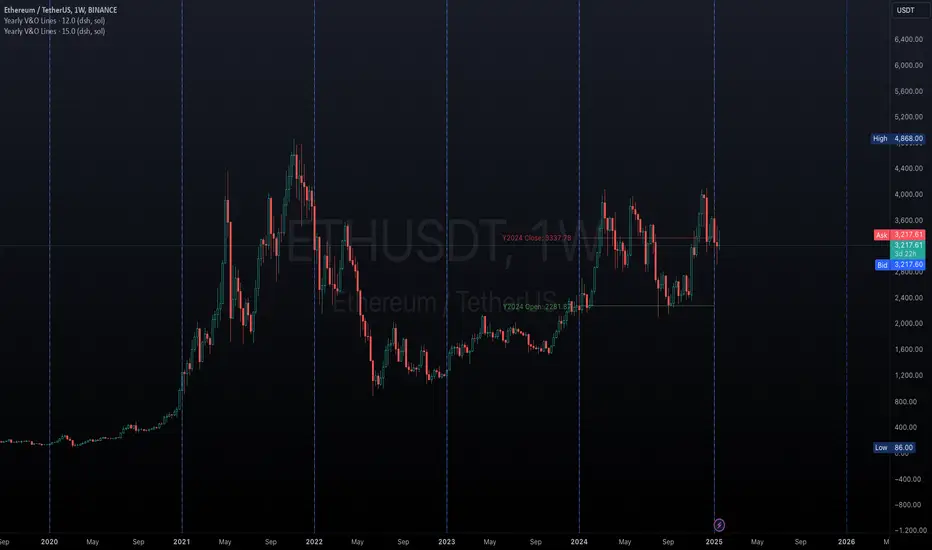
Yearly Vertical & Open Lines Indicator [OAn]
This indicator helps traders visualize yearly boundaries and track previous year's price levels. It draws:
- Vertical lines at the start of each year
- Horizontal lines showing previous year's open and close prices
- Optional labels with price information
Features:
- Customizable line colors and styles
- Toggle yearly vertical lines
- Show/hide previous year's price levels
- Optional price labels
- Next year line preview
Usage:
1. Add indicator to your chart
2. Adjust Base Time to match your market's yearly reset time
3. Customize colors and styles using input options
4. Toggle features as needed
סקריפט קוד פתוח
ברוח האמיתית של TradingView, יוצר הסקריפט הזה הפך אותו לקוד פתוח, כך שסוחרים יוכלו לעיין בו ולאמת את פעולתו. כל הכבוד למחבר! אמנם ניתן להשתמש בו בחינם, אך זכור כי פרסום חוזר של הקוד כפוף ל־כללי הבית שלנו.
כתב ויתור
המידע והפרסומים אינם מיועדים להיות, ואינם מהווים, ייעוץ או המלצה פיננסית, השקעתית, מסחרית או מכל סוג אחר המסופקת או מאושרת על ידי TradingView. קרא עוד ב־תנאי השימוש.