OPEN-SOURCE SCRIPT
Walnut Levels
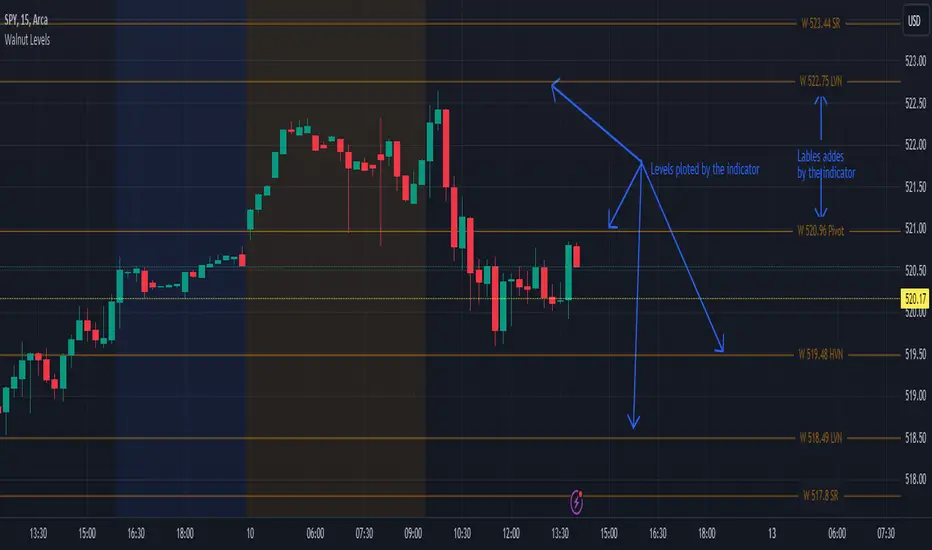
This indicator was specifically designed to plot levels published by Walnut on SPY and ES charts. In the indicator's configuration settings, you are required to input the desired levels in the following format: <Level> (Description), <Level> (Description), <Level> (Description), .... Additionally, you have the option to configure whether to display labels and if those labels should include the numeric value of the level or just the description.
Moreover, the indicator allows customization of both color and line style via configuration settings. This flexibility enables users to tailor the appearance of the plotted levels according to their preferences. If there are no levels to plot, a message will be displayed indicating so.
Overall, the indicator streamlines the process of incorporating Walnut's published levels into trading analysis on SPY and ES charts, offering enhanced visualization and customization options to suit individual trading strategies.
סקריפט קוד פתוח
ברוח האמיתית של TradingView, יוצר הסקריפט הזה הפך אותו לקוד פתוח, כך שסוחרים יוכלו לעיין בו ולאמת את פעולתו. כל הכבוד למחבר! אמנם ניתן להשתמש בו בחינם, אך זכור כי פרסום חוזר של הקוד כפוף ל־כללי הבית שלנו.
כתב ויתור
המידע והפרסומים אינם מיועדים להיות, ואינם מהווים, ייעוץ או המלצה פיננסית, השקעתית, מסחרית או מכל סוג אחר המסופקת או מאושרת על ידי TradingView. קרא עוד ב־תנאי השימוש.