OPEN-SOURCE SCRIPT
ETH Top, Mid and Bottom Cap Bands [jcray]
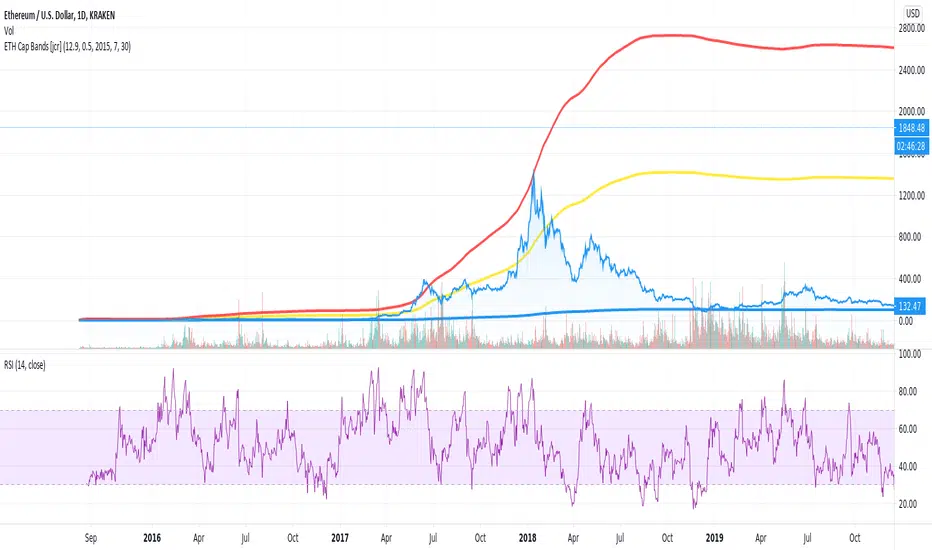
Modified from Average Cap [aamonkey] and Top Cap [aamonkey].
The top cap (red line) can be seen as an absolute market top that may never be significantly exceeded and so is a good indicator to sell a position, or enter a long-term short-sell.
The mid cap (yellow line) can be used as an indicator for market sentiment. Above the mid cap, the market is in a bullish environment, and below it, the market is in a bearish environment.
The bottom cap (blue line) can be seen as an absolute market bottom that may never be fallen short of, and so is a good indicator to enter a long-term buying opportunity, or exit a long-term short-sell.
סקריפט קוד פתוח
ברוח האמיתית של TradingView, יוצר הסקריפט הזה הפך אותו לקוד פתוח, כך שסוחרים יוכלו לעיין בו ולאמת את פעולתו. כל הכבוד למחבר! אמנם ניתן להשתמש בו בחינם, אך זכור כי פרסום חוזר של הקוד כפוף ל־כללי הבית שלנו.
כתב ויתור
המידע והפרסומים אינם מיועדים להיות, ואינם מהווים, ייעוץ או המלצה פיננסית, השקעתית, מסחרית או מכל סוג אחר המסופקת או מאושרת על ידי TradingView. קרא עוד ב־תנאי השימוש.