OPEN-SOURCE SCRIPT
מעודכן Upside Downside Unchanged Volume

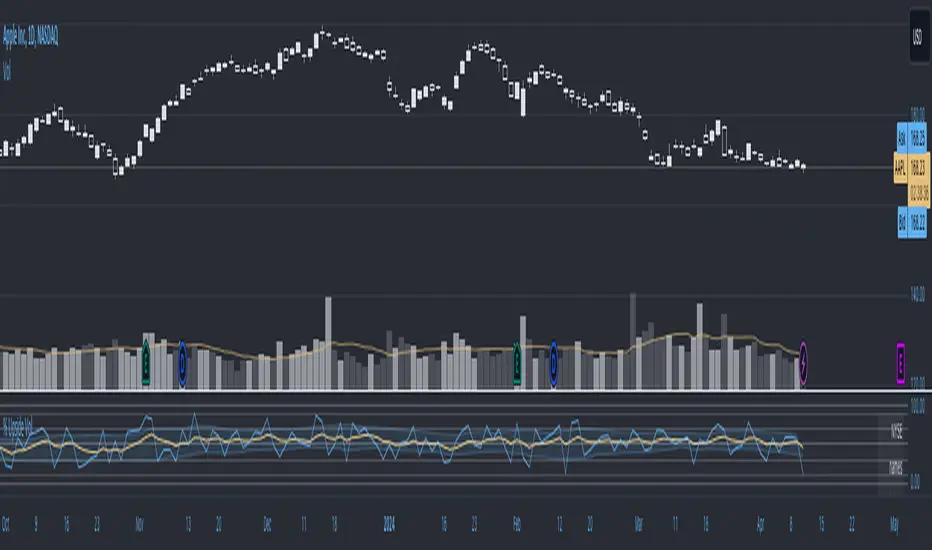
Upside Downside Unchanged Volume
- Plot NYSE or NASDAQ Upside Volume, Downside Volume, or Unchanged Volume (e.g. UPVOL.NY, UVOL, or ADVN.NY) as a percent (values 0 to 1, where 1 = 100%) of Total Volume.
- Plot Day, Week, and Month volume and/or chart timeframe period volume.
- Plot volume as a histogram, line, or area.
- Plot various moving averages of volume points.
- Horizontal lines at 0, 10, 30, 50, 70, 90, and 100% levels.
- Inspired by Paul Desmond of Lowry’s Reports.
הערות שחרור
Updated script notes:- Plot NYSE or NASDAQ Upside Volume, Downside Volume, or Unchanged Volume as a percent of Total Volume.
- Values are plotted 0 to 1, where 1 = 100%.
- Example of variables: USI:UPVOL.NY/DNVOL.NY/UNCHVOL.NY vs USI:TVOL.NY (Volume), USI:UVOL/DVOL/XVOL vs USI:TVOL (Volume), and USI:ADVN.NY/DECL.NY/UNCH.NY vs USI:ACTV.NY (Issues)
- Plot Day, Week, and Month volume and/or chart timeframe period volume.
- Plot volume as a histogram, line, or area.
- Plot various moving averages of volume points.
- Horizontal lines at 0, .10, .30, .50, .70, .90, and 1.00 levels.
- Inspired by Paul Desmond of Lowry’s Reports.
הערות שחרור
Added moving averages from values above or below a specified % of total volume.הערות שחרור
Changed settings titlesהערות שחרור
Added notes.הערות שחרור
fixed errorsהערות שחרור
Edited section headingsהערות שחרור
added a table to report the current percent up or downהערות שחרור
edited tableהערות שחרור
changed colors and defaultsהערות שחרור
Corrected an error in the code.סקריפט קוד פתוח
ברוח האמיתית של TradingView, יוצר הסקריפט הזה הפך אותו לקוד פתוח, כך שסוחרים יוכלו לעיין בו ולאמת את פעולתו. כל הכבוד למחבר! אמנם ניתן להשתמש בו בחינם, אך זכור כי פרסום חוזר של הקוד כפוף ל־כללי הבית שלנו.
כתב ויתור
המידע והפרסומים אינם מיועדים להיות, ואינם מהווים, ייעוץ או המלצה פיננסית, השקעתית, מסחרית או מכל סוג אחר המסופקת או מאושרת על ידי TradingView. קרא עוד ב־תנאי השימוש.
סקריפט קוד פתוח
ברוח האמיתית של TradingView, יוצר הסקריפט הזה הפך אותו לקוד פתוח, כך שסוחרים יוכלו לעיין בו ולאמת את פעולתו. כל הכבוד למחבר! אמנם ניתן להשתמש בו בחינם, אך זכור כי פרסום חוזר של הקוד כפוף ל־כללי הבית שלנו.
כתב ויתור
המידע והפרסומים אינם מיועדים להיות, ואינם מהווים, ייעוץ או המלצה פיננסית, השקעתית, מסחרית או מכל סוג אחר המסופקת או מאושרת על ידי TradingView. קרא עוד ב־תנאי השימוש.