OPEN-SOURCE SCRIPT
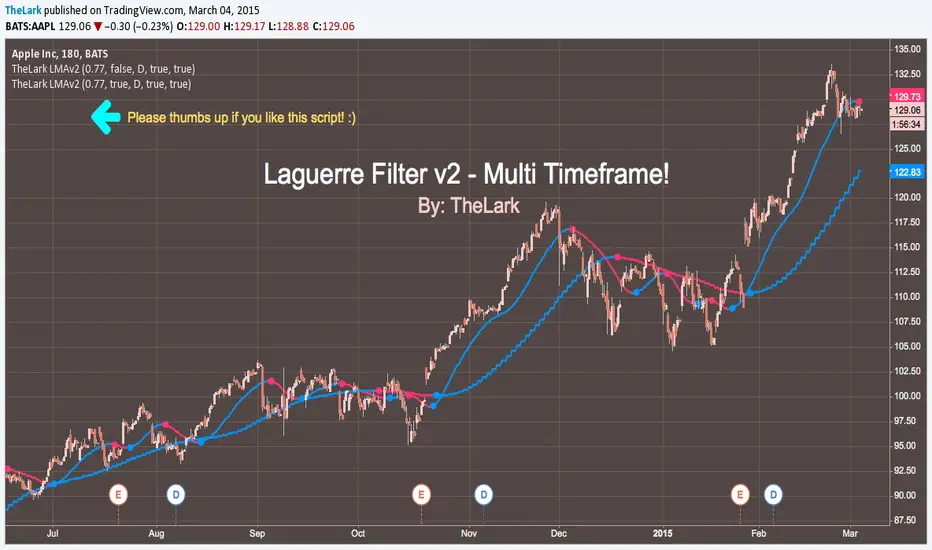
TheLark LMA (Laguerre) v2 - multi timeframe
What's new?
v2 has added multi timeframe support.
Blatantly stole Chris Moody's code for multi timeframe, because why re-invent the wheel? Thanks Chris ;P
BUT -- modified the coloring to work correctly with higher timeframes, just another Lark hack, so it's a give and take :)
_____________________________
The Laguerre Average (filter) was discovered by John Ehlers.
It's a newer type of averaging that is meant to take out as much of the
inherent lag that your typical EMA and SMA's give at the start of a major trend change.
So what you get is an average that turns more quickly at major trend changes,
and doesn't get tripped up on the noise (as much).
_____________________________
Please thumbs up/ star/ whatever this script if you like it & use it!
See my profile for more scripts, & be sure to follow for future releases.
Sorry for my hiatus, extremely busy these days working on both my own and client work.
This script was a user request.
סקריפט קוד פתוח
ברוח האמיתית של TradingView, יוצר הסקריפט הזה הפך אותו לקוד פתוח, כך שסוחרים יוכלו לעיין בו ולאמת את פעולתו. כל הכבוד למחבר! אמנם ניתן להשתמש בו בחינם, אך זכור כי פרסום חוזר של הקוד כפוף ל־כללי הבית שלנו.
כתב ויתור
המידע והפרסומים אינם מיועדים להיות, ואינם מהווים, ייעוץ או המלצה פיננסית, השקעתית, מסחרית או מכל סוג אחר המסופקת או מאושרת על ידי TradingView. קרא עוד ב־תנאי השימוש.