NQ Key Levels Map
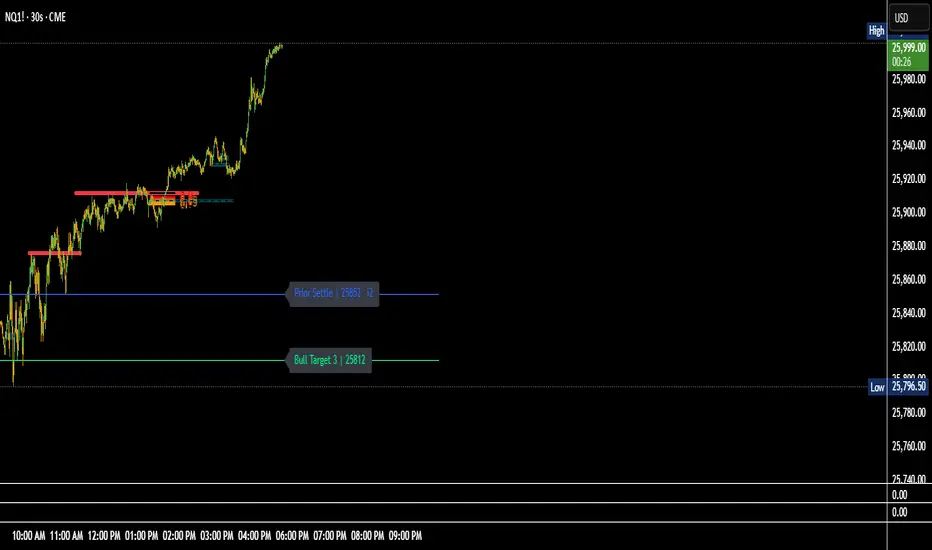
This indicator helps traders maintain spatial awareness of critical price zones throughout the session without cluttering the chart.
💡 Key Features:
🟩 Bullish Levels (Green)
Max ATM – highest key level or equilibrium pivot.
Bull Trigger – upside breakout or entry confirmation.
Bull Targets 1–3 – progressive profit targets for bullish continuation.
🟥 Bearish Levels (Red)
Min ATM – lowest key level or equilibrium pivot.
Bear Trigger – downside breakout or short confirmation.
Bear Targets 1–3 – progressive downside objectives.
Overnight Low – prior session low reference.
🟦 Contextual Levels (Blue)
Overnight High – prior session high reference.
Flip Area – inflection zone where sentiment can shift.
Prior Settle – yesterday’s settlement price anchor.
סקריפט להזמנה בלבד
רק משתמשים שאושרו על ידי המחבר יכולים לגשת לסקריפט הזה. יהיה עליך לשלוח בקשת גישה ולקבל אישור לשימוש. בדרך כלל, הגישה ניתנת לאחר תשלום. למידע נוסף, עקוב אחר ההוראות של היוצר בהמשך או צור קשר עם crptoworthy ישירות.
TradingView לא ממליצה לשלם עבור סקריפט או להשתמש בו אלא אם כן אתה סומך לחלוטין על המחבר שלו ומבין כיצד הוא פועל. ייתכן שתוכל גם למצוא חלופות חינמיות וקוד פתוח ב-סקריפטים הקהילתיים שלנו.
הוראות המחבר
כתב ויתור
סקריפט להזמנה בלבד
רק משתמשים שאושרו על ידי המחבר יכולים לגשת לסקריפט הזה. יהיה עליך לשלוח בקשת גישה ולקבל אישור לשימוש. בדרך כלל, הגישה ניתנת לאחר תשלום. למידע נוסף, עקוב אחר ההוראות של היוצר בהמשך או צור קשר עם crptoworthy ישירות.
TradingView לא ממליצה לשלם עבור סקריפט או להשתמש בו אלא אם כן אתה סומך לחלוטין על המחבר שלו ומבין כיצד הוא פועל. ייתכן שתוכל גם למצוא חלופות חינמיות וקוד פתוח ב-סקריפטים הקהילתיים שלנו.