INVITE-ONLY SCRIPT
{PREMIUM} Support And Resistance Script
מעודכן
Support and resistance is a trading technique that has been around for decades. In simple terms, support and resistance is a measure of supply and demand. While this sounds simple, it is very difficult to identify support and resistance as they happen in real time.
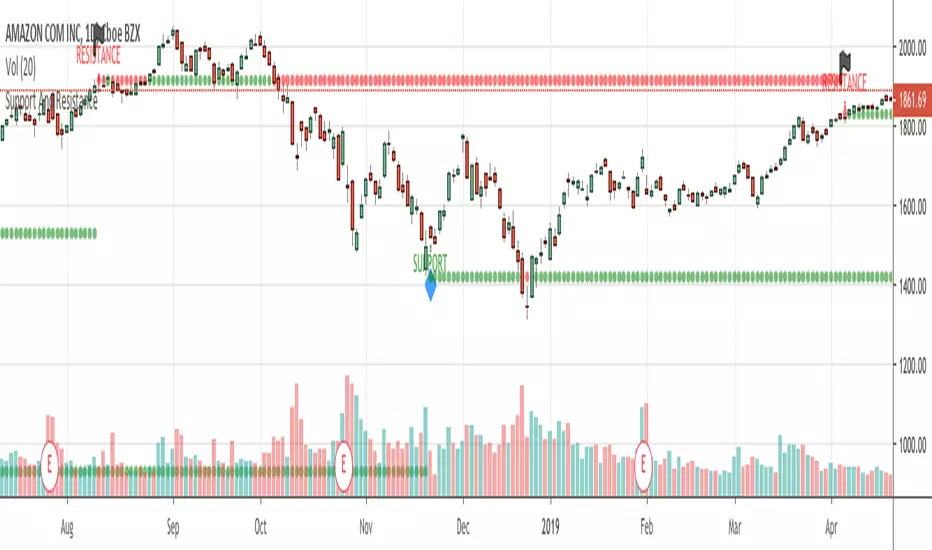
Luckily, we have a solution. The script you see below is a custom software that was developed by Mike that automatically identifies the best price levels to buy (support) at and sell (resistance) at. The software uses a proprietary algorithm that identifies when stocks are undervalued and overvalued. When a stock is undervalued, a blue diamond and the word "SUPPORT" will automatically appear on your chart. Additionally, when a stock is overvalued, a black flag and the word "RESISTANCE" will automatically appear on your chart.
When you sign up for our program you have 100% full access to use the support and resistance script on all major stock exchanges, global currency pairs, worldwide indexes, 30+ crypto exchanges, and more. In addition to having completely automatic support and resistance points on your chart, you will have exclusive access to a screener that scans through 19,000 stocks every night and finds the best stocks to buy now. The screener shows stocks that have huge upside potential with minimal downside risk. The stocks on the list are in the $1 - $300 price range, so this screener is suitable for all types of traders.
הערות שחרור
UPDATEThis new version now plots the support (green) and resistance (red) levels
סקריפט להזמנה בלבד
הגישה לסקריפט זה מוגבלת למשתמשים שהוסמכו על ידי הכותב ובדרך כלל דורשת תשלום. אתה יכול להוסיף אותו למועדפים שלך, אך תוכל להשתמש בו רק לאחר שתבקש אישור ותקבל אותו מהמחבר שלו. למידע נוסף, צור קשר עם m_p_d3, או עקוב אחר הוראות המחבר למטה.
TradingView לא מציעה לשלם עבור סקריפט ולהשתמש בו אלא אם כן אתה סומך ב-100% על המחבר שלו ומבין כיצד הסקריפט עובד. במקרים רבים, אתה יכול למצוא אלטרנטיבה טובה לקוד פתוח בחינם בבסקריפטים הקהילתיים שלנו.
הוראות המחבר
″
רוצה להשתמש בסקריפ זה בגרף?
אזהרה: נא לקרוא לפני בקשת גישה.
כתב ויתור
המידע והפרסומים אינם אמורים להיות, ואינם מהווים, עצות פיננסיות, השקעות, מסחר או סוגים אחרים של עצות או המלצות שסופקו או מאושרים על ידי TradingView. קרא עוד בתנאים וההגבלות.