OPEN-SOURCE SCRIPT
Table: Colorable Timeframes Top-Down Analysis
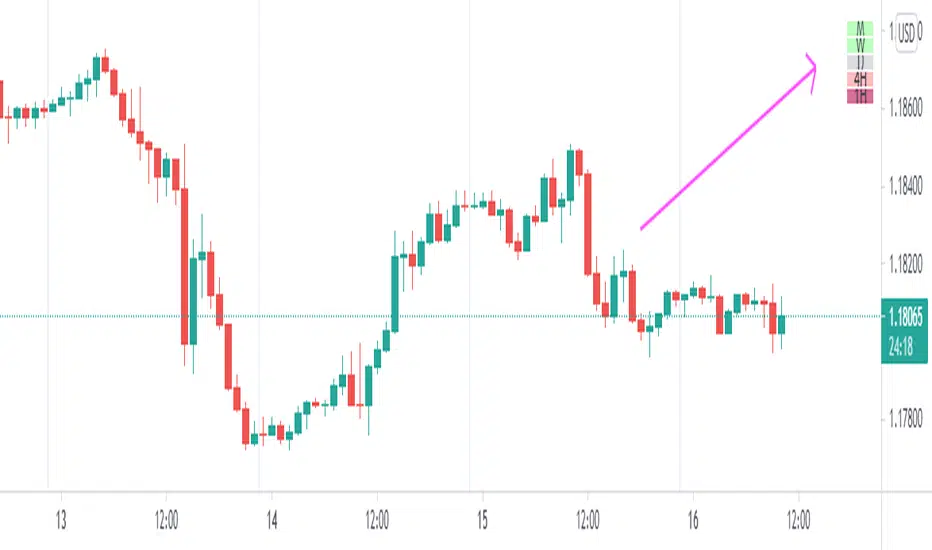
This is a very simple indicator that lets you color up to five different cells. After doing Top-Down analysis, you are probably going to stay on the lowest of timeframes, and if you work with many tickers, you may forget the bigger picture or confuse them.
So you can make some timeframes green if they are bullish or red if they are bearish and you will always have a reminder on the screen in the form of this small non-intrusive table.
So you can make some timeframes green if they are bullish or red if they are bearish and you will always have a reminder on the screen in the form of this small non-intrusive table.
סקריפט קוד פתוח
ברוח האמיתית של TradingView, יוצר הסקריפט הזה הפך אותו לקוד פתוח, כך שסוחרים יוכלו לעיין בו ולאמת את פעולתו. כל הכבוד למחבר! אמנם ניתן להשתמש בו בחינם, אך זכור כי פרסום חוזר של הקוד כפוף ל־כללי הבית שלנו.
כתב ויתור
המידע והפרסומים אינם מיועדים להיות, ואינם מהווים, ייעוץ או המלצה פיננסית, השקעתית, מסחרית או מכל סוג אחר המסופקת או מאושרת על ידי TradingView. קרא עוד ב־תנאי השימוש.