KP GPS
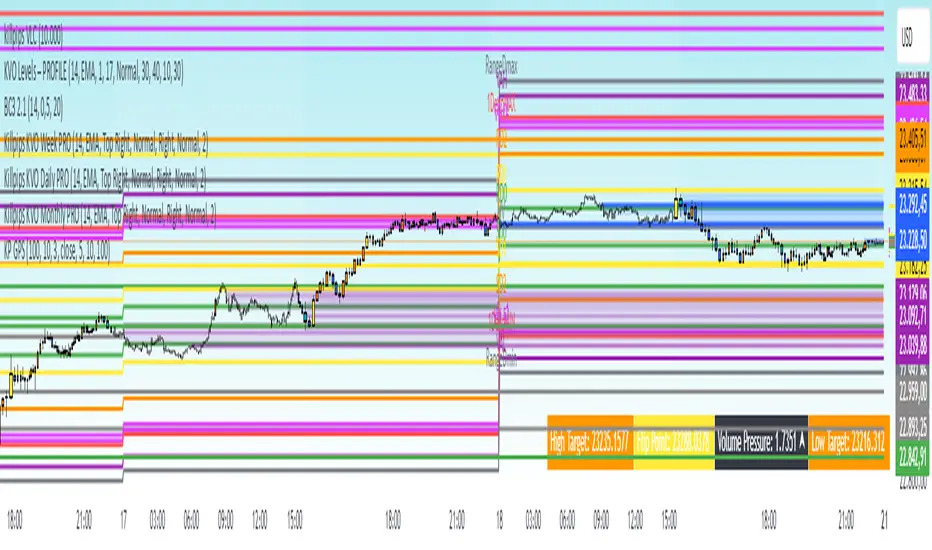
KP GPS is an advanced indicator that shows four key values in a dynamic table:
1. High Target
2. Flip Point
3. Volume Pressure
4. Low Target
Each of these values is calculated using polynomial and fractal formulas, and changes color when certain levels are reached, making it easier to read the market and identify potential changes in direction.
High Target e Low Target
- High Target: Potential upper level, target of a bullish movement.
- Low Target: potential lower level, for bearish movements.
- Color changes: When price approaches or reaches these targets, the chart updates the coloring (alert to the trader of a critical level).
. Flip Point
- Description: Points where the market tends to reverse direction (based on fractal algorithms).
- Visual indication: the Flip Point changes color in the table, signaling possible reversals to be monitored.
Volume Pressure
- Function: Measures the "pressure" of the volume, similar to the tachometer of an engine.
- Operational Impact: High Volume Pressure values indicate high market activity (potential breaks or accelerations), while low values suggest relative calm
1 ora fa
Note di rilascio
KP GPS
KP GPS is an advanced indicator that shows four key values in a dynamic table:
1. High Target
2. Flip Point
3. Volume Pressure
4. Low Target
Each of these values is calculated using polynomial and fractal formulas, and changes color when certain levels are reached, making it easier to read the market and identify potential changes in direction.
High Target e Low Target
- High Target: Potential upper level, target of a bullish movement.
- Low Target: potential lower level, for bearish movements.
- Color changes: When price approaches or reaches these targets, the chart updates the coloring (alert to the trader of a critical level).
. Flip Point
- Description: Points where the market tends to reverse direction (based on fractal algorithms).
- Visual indication: the Flip Point changes color in the table, signaling possible reversals to be monitored.
Volume Pressure
- Function: Measures the "pressure" of the volume, similar to the tachometer of an engine.
- Operational Impact: High Volume Pressure values indicate high market activity (potential breaks or accelerations), while low values suggest relative calm
34 minuti fa
Note di rilascio
KP GPS
KP GPS is an advanced indicator that shows four key values in a dynamic table:
1. High Target
2. Flip Point
3. Volume Pressure
4. Low Target
Each of these values is calculated using polynomial and fractal formulas, and changes color when certain levels are reached, making it easier to read the market and identify potential changes in direction.
High Target e Low Target
- High Target: Potential upper level, target of a bullish movement.
- Low Target: potential lower level, for bearish movements.
- Color changes: When price approaches or reaches these targets, the chart updates the coloring (alert to the trader of a critical level).
. Flip Point
- Description: Points where the market tends to reverse direction (based on fractal algorithms).
- Visual indication: the Flip Point changes color in the table, signaling possible reversals to be monitored.
Volume Pressure
- Function: Measures the "pressure" of the volume, similar to the tachometer of an engine.
- Operational Impact: High Volume Pressure values indicate high market activity (potential breaks or accelerations), while low values suggest relative calm
סקריפט להזמנה בלבד
רק משתמשים שאושרו על ידי המחבר יכולים לגשת לסקריפט הזה. יהיה עליך לשלוח בקשת גישה ולקבל אישור לשימוש. בדרך כלל, הגישה ניתנת לאחר תשלום. למידע נוסף, עקוב אחר ההוראות של היוצר בהמשך או צור קשר עם killpips ישירות.
שים לב שסקריפט פרטי זה, המוזמן בלבד, לא נבדק על ידי מנהלי סקריפטים, ועמידתו בכללי הבית לא נקבעה. TradingView לא ממליצה לשלם עבור סקריפט או להשתמש בו אלא אם כן אתה סומך לחלוטין על המחבר שלו ומבין כיצד הוא פועל. ייתכן שתוכל גם למצוא חלופות חינמיות וקוד פתוח ב-סקריפטים הקהילתיים שלנו.
הוראות המחבר
כתב ויתור
סקריפט להזמנה בלבד
רק משתמשים שאושרו על ידי המחבר יכולים לגשת לסקריפט הזה. יהיה עליך לשלוח בקשת גישה ולקבל אישור לשימוש. בדרך כלל, הגישה ניתנת לאחר תשלום. למידע נוסף, עקוב אחר ההוראות של היוצר בהמשך או צור קשר עם killpips ישירות.
שים לב שסקריפט פרטי זה, המוזמן בלבד, לא נבדק על ידי מנהלי סקריפטים, ועמידתו בכללי הבית לא נקבעה. TradingView לא ממליצה לשלם עבור סקריפט או להשתמש בו אלא אם כן אתה סומך לחלוטין על המחבר שלו ומבין כיצד הוא פועל. ייתכן שתוכל גם למצוא חלופות חינמיות וקוד פתוח ב-סקריפטים הקהילתיים שלנו.