OPEN-SOURCE SCRIPT
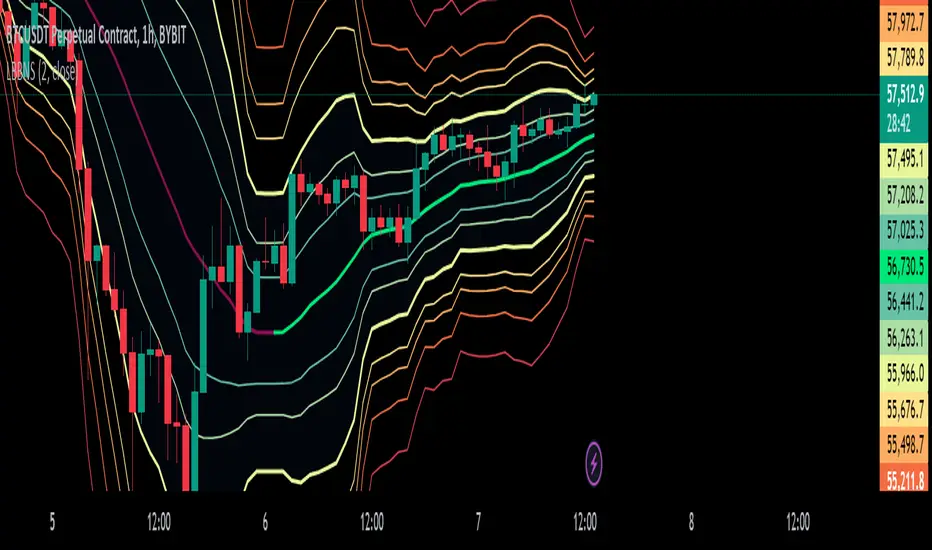
מעודכן Logarithmic Bollinger Bands [MisterMoTA]

The script plot the normal top and bottom Bollinger Bands and from them and SMA 20 it finds fibonacci logarithmic levels where price can find temporary support/resistance.
To get the best results need to change the standard deviation to your simbol value, like current for BTC the Standards Deviation is 2.61, current Standard Deviation for ETH is 2.55.. etc.. find the right current standard deviation of your simbol with a search online.
The lines ploted by indicators are:
Let me know If you find the indicator useful or PM if you need any custom changes to it.
To get the best results need to change the standard deviation to your simbol value, like current for BTC the Standards Deviation is 2.61, current Standard Deviation for ETH is 2.55.. etc.. find the right current standard deviation of your simbol with a search online.
The lines ploted by indicators are:
- Main line is a 20 SMA
- 2 retracement Logarithmic Fibonacci 0.382 levels above and bellow 20 sma
- 2 retracement Logarithmic Fibonacci 0.618 levels above and bellow 20 sma
- Top and Bottom Bollindger bands (ticker than the rest of the lines)
- 2 expansion Logarithmic Fibonacci 0.382 levels above Top BB and bellow Bottom BB
- 2 expansion Logarithmic Fibonacci 0.618 levels above Top BB and bellow Bottom BB
- 2 expansion Logarithmic Fibonacci level 1 above Top BB and bellow Bottom BB
- 2 expansion Logarithmic Fibonacci 1.618 levels above Top BB and bellow Bottom BB
Let me know If you find the indicator useful or PM if you need any custom changes to it.
הערות שחרור
- removed decimals and labels as Tradingview does a good job on displaying the labels on scales
- option to hide values on scales
- added color coded trend for 20 sma that can be disabled from dashboard
סקריפט קוד פתוח
ברוח האמיתית של TradingView, יוצר הסקריפט הזה הפך אותו לקוד פתוח, כך שסוחרים יוכלו לעיין בו ולאמת את פעולתו. כל הכבוד למחבר! אמנם ניתן להשתמש בו בחינם, אך זכור כי פרסום חוזר של הקוד כפוף ל־כללי הבית שלנו.
כתב ויתור
המידע והפרסומים אינם מיועדים להיות, ואינם מהווים, ייעוץ או המלצה פיננסית, השקעתית, מסחרית או מכל סוג אחר המסופקת או מאושרת על ידי TradingView. קרא עוד ב־תנאי השימוש.