OPEN-SOURCE SCRIPT
Trend Analyzer
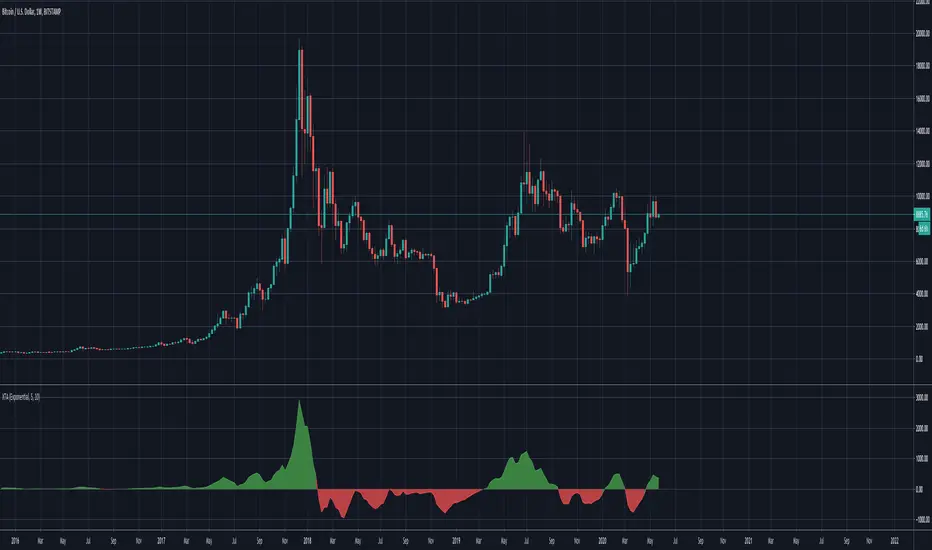
A simple script that plots difference between 2 moving averages and depicts convergance/divergance in color coded format.
Anything <= 0 is red and shows a bearish trend whereas > 0 is green and shows bullish trend.
Adjust the input parameters as following for your preferred time frame :
Anything <= 0 is red and shows a bearish trend whereas > 0 is green and shows bullish trend.
Adjust the input parameters as following for your preferred time frame :
- 4-Hr: Exponential, 15, 30
- Daily: Exponential, 10, 20
- Weekly: Exponential, 5, 10
סקריפט קוד פתוח
ברוח האמיתית של TradingView, יוצר הסקריפט הזה הפך אותו לקוד פתוח, כך שסוחרים יוכלו לעיין בו ולאמת את פעולתו. כל הכבוד למחבר! אמנם ניתן להשתמש בו בחינם, אך זכור כי פרסום חוזר של הקוד כפוף ל־כללי הבית שלנו.
כתב ויתור
המידע והפרסומים אינם מיועדים להיות, ואינם מהווים, ייעוץ או המלצה פיננסית, השקעתית, מסחרית או מכל סוג אחר המסופקת או מאושרת על ידי TradingView. קרא עוד ב־תנאי השימוש.