OPEN-SOURCE SCRIPT
Doji Followed by Bullish or Bearish Candle

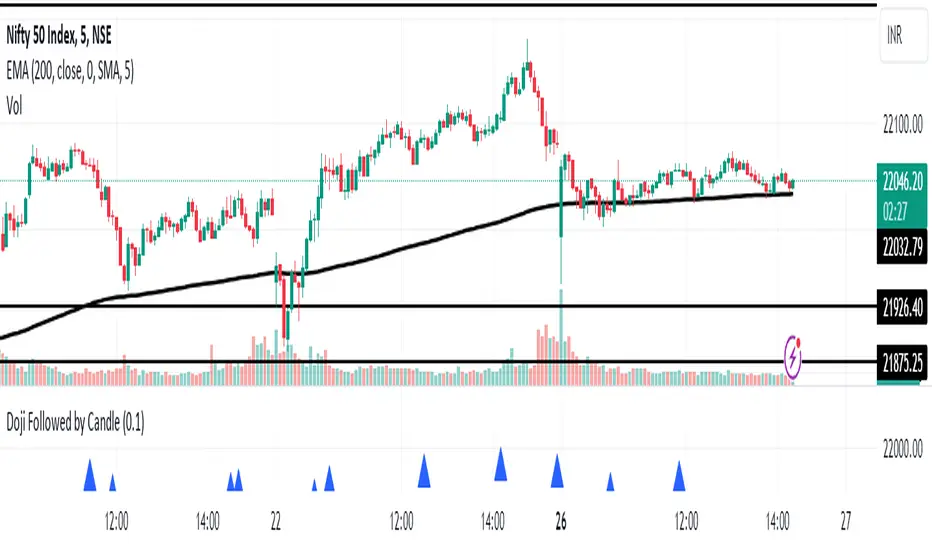
This indicator identifies instances where a doji candlestick pattern is followed by either a bullish or bearish candle, indicating potential reversal or continuation signals in the market.
Features:
Doji Detection: Utilizes the concept of doji candlesticks, where the difference between the open and close prices is minimal compared to the candle's overall range.
Candlestick Identification: Determines whether the following candle is bullish (close > open) or bearish (close < open).
Customizable Threshold: Allows users to adjust the sensitivity of the doji detection by modifying the doji body factor parameter.
Alerts: Generates alerts when a doji candle is followed by a bullish or bearish candle, signaling potential trading opportunities.
How to Use:
When a blue triangle appears below a candle, it indicates that a doji candle was followed by a bullish or bearish candle.
Traders can interpret these signals as potential entry or exit points in their trading strategies.
Note: This indicator should be used in conjunction with other technical analysis tools and indicators for comprehensive market analysis.
סקריפט קוד פתוח
ברוח האמיתית של TradingView, יוצר הסקריפט הזה הפך אותו לקוד פתוח, כך שסוחרים יוכלו לעיין בו ולאמת את פעולתו. כל הכבוד למחבר! אמנם ניתן להשתמש בו בחינם, אך זכור כי פרסום חוזר של הקוד כפוף ל־כללי הבית שלנו.
כתב ויתור
המידע והפרסומים אינם מיועדים להיות, ואינם מהווים, ייעוץ או המלצה פיננסית, השקעתית, מסחרית או מכל סוג אחר המסופקת או מאושרת על ידי TradingView. קרא עוד ב־תנאי השימוש.