OPEN-SOURCE SCRIPT
Financial Astrology Mars Declination
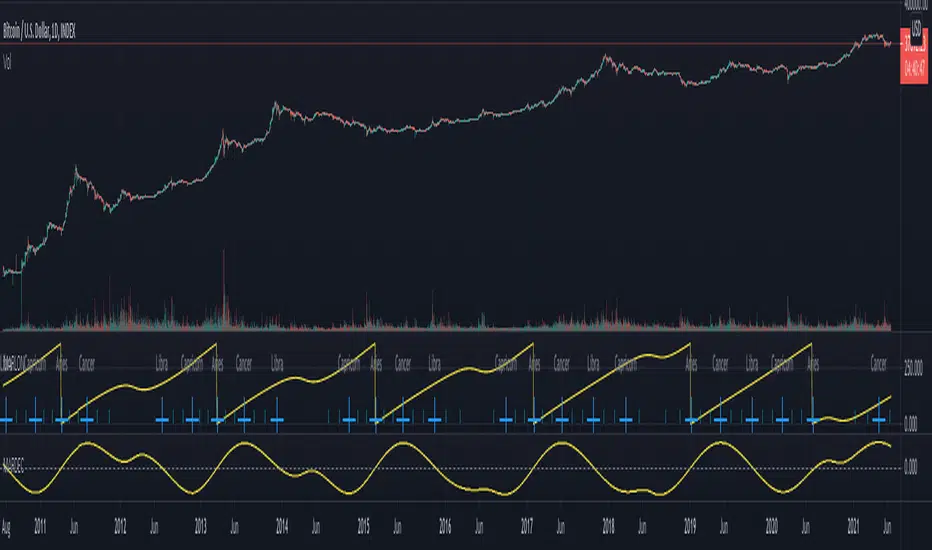
Mars crossing zero declination through the north direction exhibits more stronger force in the impulsive and aggressive price fluctuations, for BTCUSD we can see that in many of the occurrences there was very intense price action on this cryptocurrency. In the contrary when crossed the zero declination through the south declination direction, in many occurrences the price was in congestion / consolidation.
Is very likely that similar pattern repeats in others markets so will be great to get the participation of other financial astrologers that could research this declination cycle and share feedback with us.
Note: The Mars declination indicator is based on an ephemeris array that covers years 2010 to 2030, prior or after this years the declination is not available, this daily ephemeris are based on UTC time so in order to align properly with the price bars times you should set UTC as your chart reference timezone.
סקריפט קוד פתוח
ברוח האמיתית של TradingView, יוצר הסקריפט הזה הפך אותו לקוד פתוח, כך שסוחרים יוכלו לעיין בו ולאמת את פעולתו. כל הכבוד למחבר! אמנם ניתן להשתמש בו בחינם, אך זכור כי פרסום חוזר של הקוד כפוף ל־כללי הבית שלנו.
כתב ויתור
המידע והפרסומים אינם מיועדים להיות, ואינם מהווים, ייעוץ או המלצה פיננסית, השקעתית, מסחרית או מכל סוג אחר המסופקת או מאושרת על ידי TradingView. קרא עוד ב־תנאי השימוש.