INVITE-ONLY SCRIPT
Adam-Cox LTC Realised v1 Invite-Only
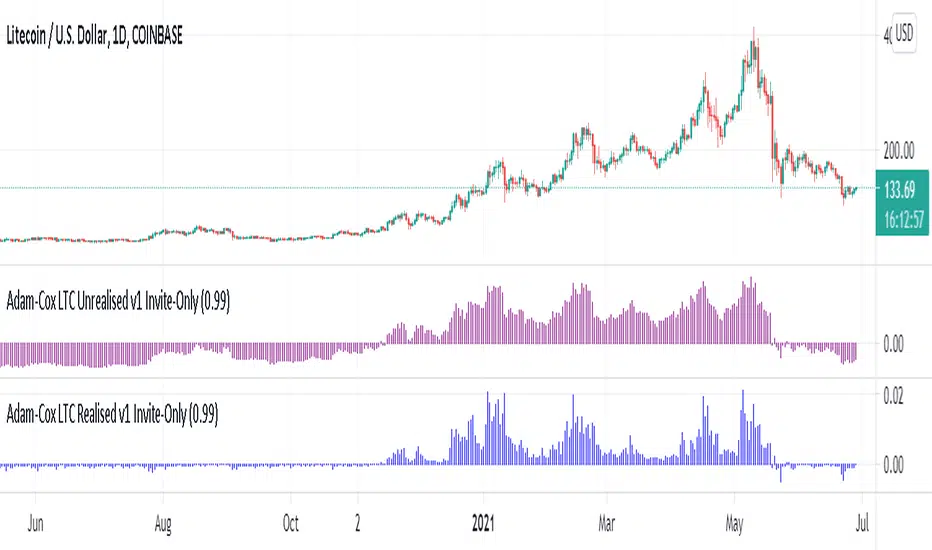
Use on daily LTC charts to understand where potential price action is occurring during peaks of profit and loss taking place on-average in the market. In the same way where large turnover can be used to identify areas of profit taking, or loss realisation (i.e. losing trade close-out) , this study examines this phenomena directly and is similar to indicators published for DOGE and BTC.
סקריפט להזמנה בלבד
הגישה לסקריפט זה מוגבלת למשתמשים שהוסמכו על ידי הכותב ובדרך כלל דורשת תשלום. אתה יכול להוסיף אותו למועדפים שלך, אך תוכל להשתמש בו רק לאחר שתבקש אישור ותקבל אותו מהמחבר שלו. למידע נוסף, צור קשר עם Adam-Cox, או עקוב אחר הוראות המחבר למטה.
TradingView לא מציעה לשלם עבור סקריפט ולהשתמש בו אלא אם כן אתה סומך ב-100% על המחבר שלו ומבין כיצד הסקריפט עובד. במקרים רבים, אתה יכול למצוא אלטרנטיבה טובה לקוד פתוח בחינם בבסקריפטים הקהילתיים שלנו.
הוראות המחבר
″Use on daily LTC charts to understand where potential price action is occurring during peaks of profit and loss taking place on-average in the market.
רוצה להשתמש בסקריפ זה בגרף?
אזהרה: נא לקרוא לפני בקשת גישה.
כתב ויתור
המידע והפרסומים אינם אמורים להיות, ואינם מהווים, עצות פיננסיות, השקעות, מסחר או סוגים אחרים של עצות או המלצות שסופקו או מאושרים על ידי TradingView. קרא עוד בתנאים וההגבלות.