OPEN-SOURCE SCRIPT
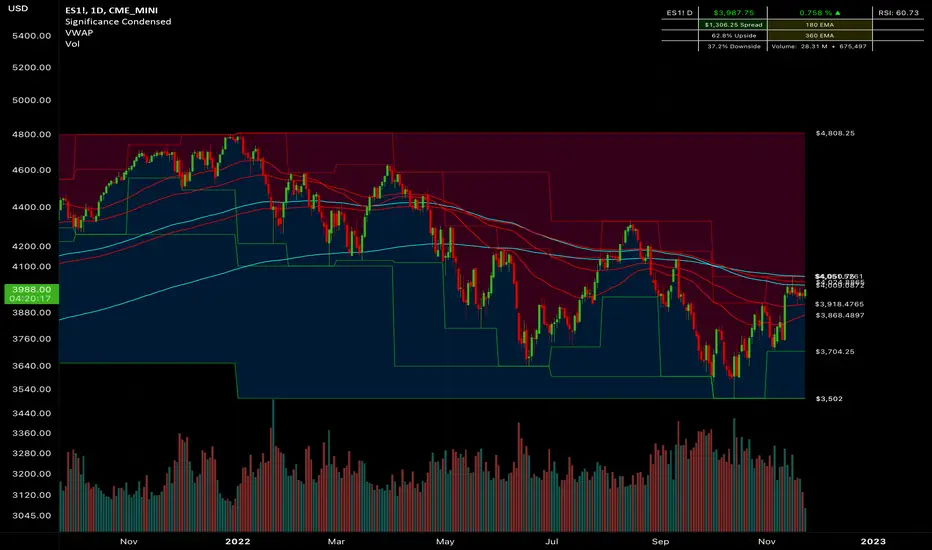
מעודכן Significance Condensed

// Indicator Name: "Significance Condensed"
// This is a "Multi-Indicator", which includes:
// Custom Candlesticks with Bearish/Bullish Engulfing Body Fills, otherwise hollow.
// 3 EMA's with user inputs + 2 Static EMA's
// Continuous plots of high/low values with up to 3 overlapping timeframes.
// Table: Contains the TICKER.ID, Current Price, Percent On Day (note that it does not work for extended hours charts well), Current Timeframe RSI Value(Adjustable), Spread(Difference from the Current Price to High value, 2 Static EMA displays, Upside/Downside(Percentile from Current Price to High/Low Range, respectively, and Volume(Daily Volume + Current Bar Volume)
//CANDLESTICK DISCLAIMER
// If you would like to use the custom candlestick plots, (hollow, else engulfing), that come along with this indicator,
// be sure to disable the Candlestick Body, Wick, and Border under Chart Appearance; and then enable "Candlesticks Active" in the indicator settings.
//Final Product. Finito. Done.
הערות שחרור
Added a tooltip to the Timeframe that is coordinated to the Spread Math on the table.Corrected a mis-titled User Ema
Corrected Timeframe Logic Flow for Ease of Understanding.
Changed some Default Colors.
Mr. Storm
Enjoy!
סקריפט קוד פתוח
ברוח האמיתית של TradingView, יוצר הסקריפט הזה הפך אותו לקוד פתוח, כך שסוחרים יוכלו לעיין בו ולאמת את פעולתו. כל הכבוד למחבר! אמנם ניתן להשתמש בו בחינם, אך זכור כי פרסום חוזר של הקוד כפוף ל־כללי הבית שלנו.
כתב ויתור
המידע והפרסומים אינם מיועדים להיות, ואינם מהווים, ייעוץ או המלצה פיננסית, השקעתית, מסחרית או מכל סוג אחר המסופקת או מאושרת על ידי TradingView. קרא עוד ב־תנאי השימוש.