OPEN-SOURCE SCRIPT
מעודכן M2 Global Liquidity Index - X Days Lead

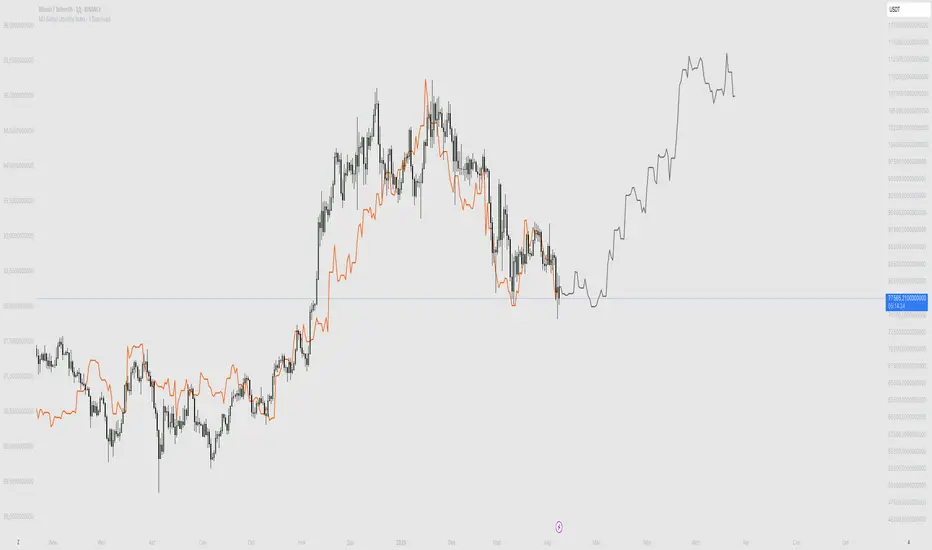
This custom indicator overlays the Bitcoin price chart with the Global Liquidity M2 chart, providing a unique perspective on how monetary supply might influence Bitcoin's price movements. The indicator distinguishes between past and future segments of the liquidity data using two distinct colors.
- Past Segment: The portion of the Global Liquidity M2 chart that has already passed is displayed in one color, allowing users to assess historical correlations with Bitcoin's price.
- Future Segment: The upcoming part of the liquidity chart is shown in a different color, offering insights into potential future impacts on Bitcoin's price trajectory.
by walkin
הערות שחרור
This custom indicator overlays the Bitcoin price chart with the Global Liquidity M2 chart, providing a unique perspective on how monetary supply might influence Bitcoin's price movements. The indicator distinguishes between past and future segments of the liquidity data using two distinct colors.- Past Segment: The portion of the Global Liquidity M2 chart that has already passed is displayed in one color, allowing users to assess historical correlations with Bitcoin's price.
- Future Segment: The upcoming part of the liquidity chart is shown in a different color, offering insights into potential future impacts on Bitcoin's price trajectory.
by walkin
סקריפט קוד פתוח
ברוח האמיתית של TradingView, יוצר הסקריפט הזה הפך אותו לקוד פתוח, כך שסוחרים יוכלו לעיין בו ולאמת את פעולתו. כל הכבוד למחבר! אמנם ניתן להשתמש בו בחינם, אך זכור כי פרסום חוזר של הקוד כפוף ל־כללי הבית שלנו.
כתב ויתור
המידע והפרסומים אינם מיועדים להיות, ואינם מהווים, ייעוץ או המלצה פיננסית, השקעתית, מסחרית או מכל סוג אחר המסופקת או מאושרת על ידי TradingView. קרא עוד ב־תנאי השימוש.