OPEN-SOURCE SCRIPT
מעודכן Single Candle Model-DTFX
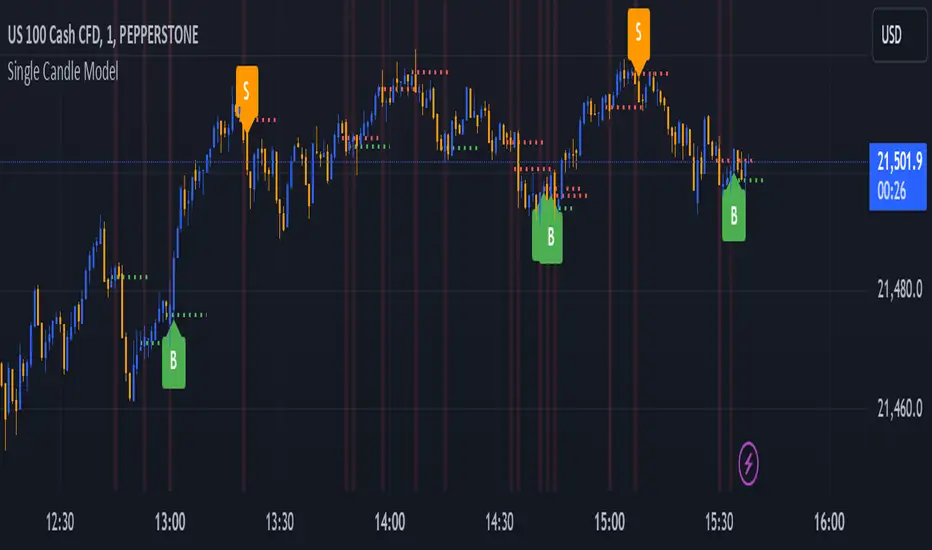
The script identifies the candles with engulfing body and marks the 50% of the candle for easy entry based on model of #DTFX single candle entry
Interpreting the Signals:
Look for candles labeled as "BE". These represent significant price action where the range is larger than the previous candle's range.
Pay attention to the 50% line of the "BE" candle:
A green line indicates a bullish "BE" candle.
A red line indicates a bearish "BE" candle.
Watch for Buy ("B") and Sell ("S") labels:
"B": Indicates a potential bullish breakout.
"S": Indicates a potential bearish breakdown.
Alerts:
Configure alerts in TradingView to notify you whenever a "B" or "S" signal is detected. This allows you to act on the signals without constantly monitoring the chart.
Use in Trading Strategies:
Combine this indicator with other tools like support/resistance levels, moving averages, or trend analysis to validate the signals.
Use the midpoint (50% line) of the "BE" candle as a potential reference point for stop-loss or target levels.
Customizations:
Adjust the appearance of labels and lines by modifying their style, color, or placement in the script.
Add filters (e.g., timeframes or volume conditions) to refine the detection of "BE" candles.
This indicator helps traders identify pivotal price movements and act on potential breakouts or breakdowns with clear visual markers and alerts.
הערות שחרור
updated for the overlayסקריפט קוד פתוח
ברוח האמיתית של TradingView, יוצר הסקריפט הזה הפך אותו לקוד פתוח, כך שסוחרים יוכלו לעיין בו ולאמת את פעולתו. כל הכבוד למחבר! אמנם ניתן להשתמש בו בחינם, אך זכור כי פרסום חוזר של הקוד כפוף ל־כללי הבית שלנו.
כתב ויתור
המידע והפרסומים אינם מיועדים להיות, ואינם מהווים, ייעוץ או המלצה פיננסית, השקעתית, מסחרית או מכל סוג אחר המסופקת או מאושרת על ידי TradingView. קרא עוד ב־תנאי השימוש.
סקריפט קוד פתוח
ברוח האמיתית של TradingView, יוצר הסקריפט הזה הפך אותו לקוד פתוח, כך שסוחרים יוכלו לעיין בו ולאמת את פעולתו. כל הכבוד למחבר! אמנם ניתן להשתמש בו בחינם, אך זכור כי פרסום חוזר של הקוד כפוף ל־כללי הבית שלנו.
כתב ויתור
המידע והפרסומים אינם מיועדים להיות, ואינם מהווים, ייעוץ או המלצה פיננסית, השקעתית, מסחרית או מכל סוג אחר המסופקת או מאושרת על ידי TradingView. קרא עוד ב־תנאי השימוש.