OPEN-SOURCE SCRIPT
מעודכן Bulls vs Bears
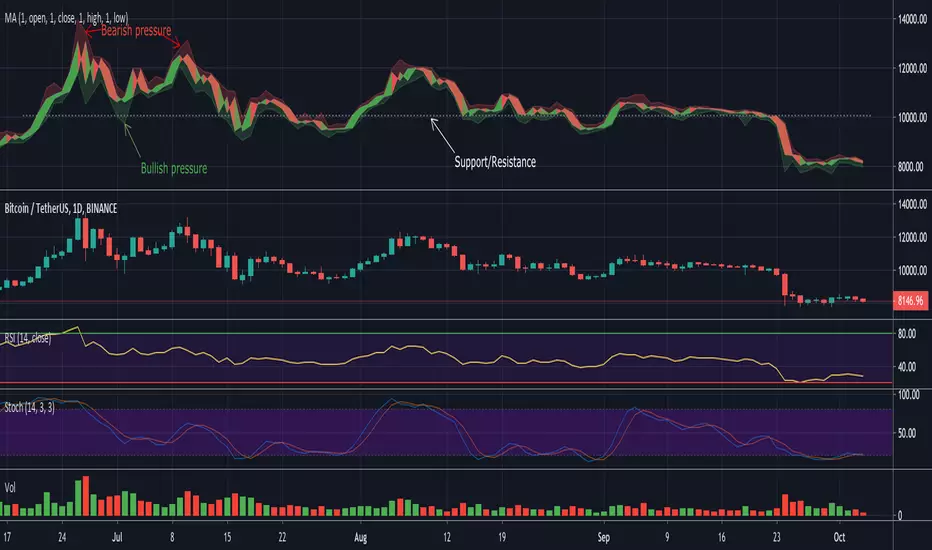
A tool with the purpose for better insight of bulls/bears influence.
The center, more bright part are the open-close prices, filled green if bullish, red if bearish.
The transparent red and green part, above and below, are the "wick/shadow" area's.
If for example the bears push the price down, far under the open, but the bulls push it right back, so you'll have a large wick,
this will be visible as a large transparent green area below the brighter open-close center area.
Hope this helps!
הערות שחרור
Also it might help to find certain support/resistance regions (more towards the open/close prices),it also can give a more clear imagine when the open and close prices are tight together.
I believe it even can bring more insights and more details regarding divergences.
סקריפט קוד פתוח
ברוח האמיתית של TradingView, יוצר הסקריפט הזה הפך אותו לקוד פתוח, כך שסוחרים יוכלו לעיין בו ולאמת את פעולתו. כל הכבוד למחבר! אמנם ניתן להשתמש בו בחינם, אך זכור כי פרסום חוזר של הקוד כפוף ל־כללי הבית שלנו.
Who are PineCoders?
tradingview.com/chart/SSP/yW5eOqtm-Who-are-PineCoders/
TG Pine Script® Q&A: t.me/PineCodersQA
- We cannot control our emotions,
but we can control our keyboard -
tradingview.com/chart/SSP/yW5eOqtm-Who-are-PineCoders/
TG Pine Script® Q&A: t.me/PineCodersQA
- We cannot control our emotions,
but we can control our keyboard -
כתב ויתור
המידע והפרסומים אינם מיועדים להיות, ואינם מהווים, ייעוץ או המלצה פיננסית, השקעתית, מסחרית או מכל סוג אחר המסופקת או מאושרת על ידי TradingView. קרא עוד ב־תנאי השימוש.