OPEN-SOURCE SCRIPT
MACD Histogram Multi-Timeframe
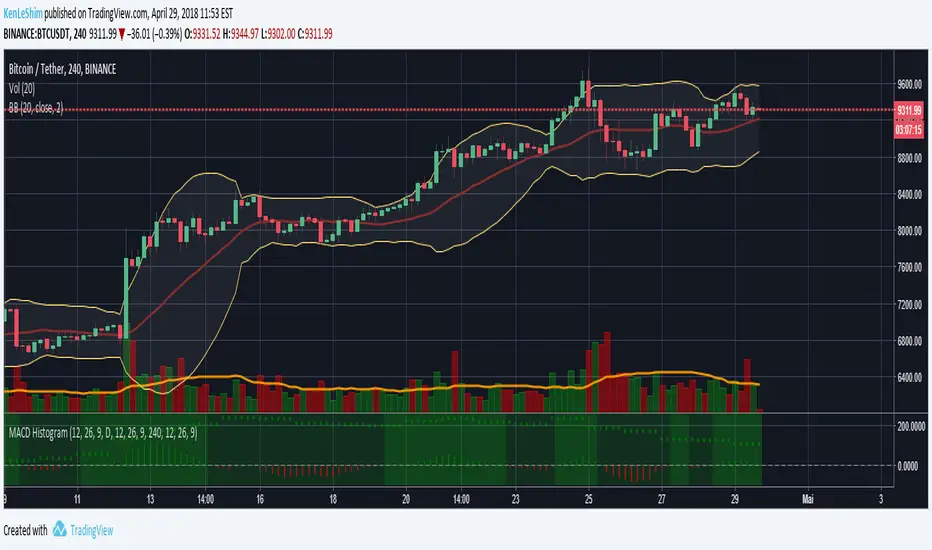
The MACD-Histogram represents the difference between the MACD (i.e., the between the two EMAs) and the signal line (i.e., the 9-day EMA of the MACD). The histogram is positive (i.e., above the zero line) when the MACD is above the signal line and negative when the MACD is below the signal line.
HOW IS IT USED ?
A bullish crossover occurs when the MACD histogram is negative and a bearish cross over occurs when the MACD histogram is negative.
I added the possibility to add on the chart a 2nd timeframe for confirmation.
If you found this script useful, a tip is always welcome... :)
HOW IS IT USED ?
A bullish crossover occurs when the MACD histogram is negative and a bearish cross over occurs when the MACD histogram is negative.
I added the possibility to add on the chart a 2nd timeframe for confirmation.
If you found this script useful, a tip is always welcome... :)
סקריפט קוד פתוח
ברוח האמיתית של TradingView, יוצר הסקריפט הזה הפך אותו לקוד פתוח, כך שסוחרים יוכלו לעיין בו ולאמת את פעולתו. כל הכבוד למחבר! אמנם ניתן להשתמש בו בחינם, אך זכור כי פרסום חוזר של הקוד כפוף ל־כללי הבית שלנו.
כתב ויתור
המידע והפרסומים אינם מיועדים להיות, ואינם מהווים, ייעוץ או המלצה פיננסית, השקעתית, מסחרית או מכל סוג אחר המסופקת או מאושרת על ידי TradingView. קרא עוד ב־תנאי השימוש.