OPEN-SOURCE SCRIPT
מעודכן Correlations P/L Range (in percent)
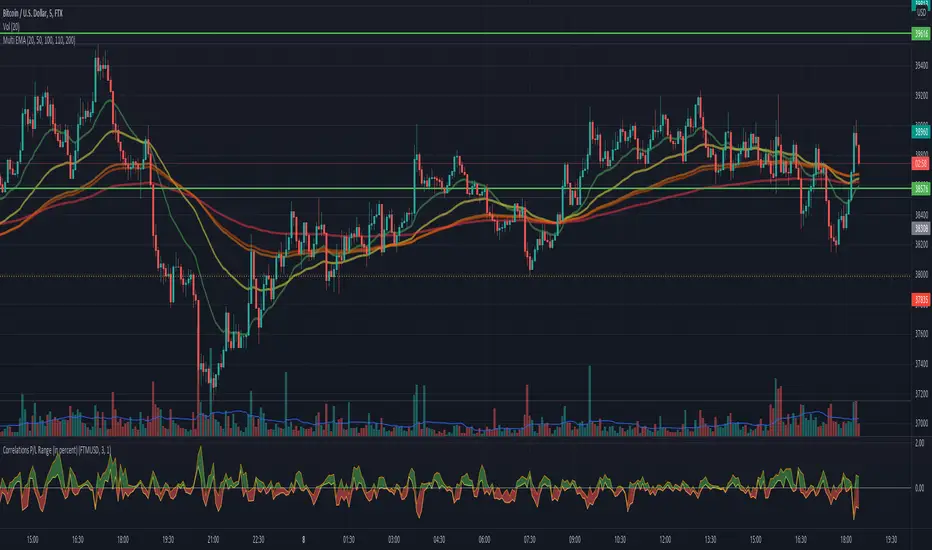
This script shows the inefficiency of the markets.
Comparing two (correlated) symbols, the values above 0 means the main symbol (at the top of the graph)
outperforms the other. A value below 0 means the main symbol underperforms the other.
The band displays different entries until the last candle. Any P/L (of the band range)
is visible in the band. Example: given a band range length of 5, then all last 5 values
are compares with the current value for both symbols. Or in other words:
If symbol A, lets say ETHUSD outperforms, lets say BITCOIN (the main symbol), in the last
5 candles, then we would see all values of the band are negative.
Any question, comment or improvements are welcome.
הערות שחרור
see description of the scriptסקריפט קוד פתוח
ברוח האמיתית של TradingView, יוצר הסקריפט הזה הפך אותו לקוד פתוח, כך שסוחרים יוכלו לעיין בו ולאמת את פעולתו. כל הכבוד למחבר! אמנם ניתן להשתמש בו בחינם, אך זכור כי פרסום חוזר של הקוד כפוף ל־כללי הבית שלנו.
כתב ויתור
המידע והפרסומים אינם מיועדים להיות, ואינם מהווים, ייעוץ או המלצה פיננסית, השקעתית, מסחרית או מכל סוג אחר המסופקת או מאושרת על ידי TradingView. קרא עוד ב־תנאי השימוש.
סקריפט קוד פתוח
ברוח האמיתית של TradingView, יוצר הסקריפט הזה הפך אותו לקוד פתוח, כך שסוחרים יוכלו לעיין בו ולאמת את פעולתו. כל הכבוד למחבר! אמנם ניתן להשתמש בו בחינם, אך זכור כי פרסום חוזר של הקוד כפוף ל־כללי הבית שלנו.
כתב ויתור
המידע והפרסומים אינם מיועדים להיות, ואינם מהווים, ייעוץ או המלצה פיננסית, השקעתית, מסחרית או מכל סוג אחר המסופקת או מאושרת על ידי TradingView. קרא עוד ב־תנאי השימוש.