PROTECTED SOURCE SCRIPT
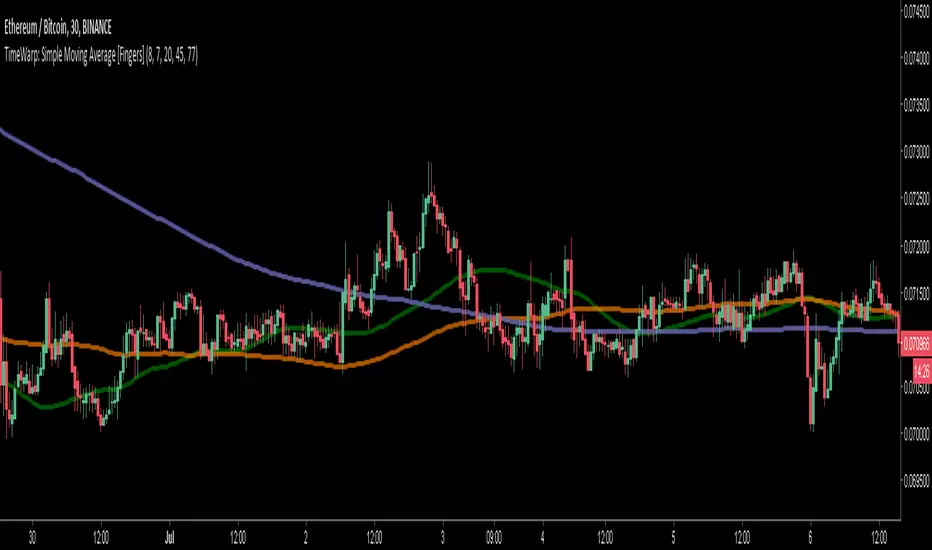
TimeWarp: Simple Moving Average [Fingers]

Normally, looking at higher timeframe indicators on a chart leaves you with missing data. For example, here I use the security call function (https://www.tradingview.com/study-script-reference/#fun_security) to display 4 hour SMAs on a 30 minute ETH/BTC chart. Notice how the SMA values are only correct once every four hours? That is a lot of missing data.

The TimeWarp Solution
TimeWarp enables you to display higher timeframe simple moving averages on your chart while overcoming the data loss inherent with using the inbuilt security call function. To achieve this, the TimeWarp code calculates the higher timeframe SMA values for every period displayed in your chart. It then applies a smoothing function to even out variation in period-to-period values that commonly occur when calculating higher timeframe indicators at every period. I selected a smoothing function that seems to me to offer low lag and that produces smoothed values very similar to those produced by the security call function. Note that the smoother is not applied when a multiplier value of "1" is used.

How to Use:
It's simple. Apply to any chart, then adjust the "Multplier" value as desired. For example, if you want to see 4 hour indicator values on a 30 minute chart you use a multiplier of "8" (240 minutes / 30 minutes = 8).
Limitations:
The current version of TimeWarp does not account for "missing candles". If there are no buys or sells for a given candle, TradingView omits the candle from your chart. When there are missing candles TimeWarp values will be slightly different.
TradingView is unable to display high multiplier values combined with large period SMAs. For example, you won't be able to see 200 period SMAs with a multiplier of 20. This is a cap set by TradingView that errors out when it has been exceeded.
The TimeWarp Solution
TimeWarp enables you to display higher timeframe simple moving averages on your chart while overcoming the data loss inherent with using the inbuilt security call function. To achieve this, the TimeWarp code calculates the higher timeframe SMA values for every period displayed in your chart. It then applies a smoothing function to even out variation in period-to-period values that commonly occur when calculating higher timeframe indicators at every period. I selected a smoothing function that seems to me to offer low lag and that produces smoothed values very similar to those produced by the security call function. Note that the smoother is not applied when a multiplier value of "1" is used.
How to Use:
It's simple. Apply to any chart, then adjust the "Multplier" value as desired. For example, if you want to see 4 hour indicator values on a 30 minute chart you use a multiplier of "8" (240 minutes / 30 minutes = 8).
Limitations:
The current version of TimeWarp does not account for "missing candles". If there are no buys or sells for a given candle, TradingView omits the candle from your chart. When there are missing candles TimeWarp values will be slightly different.
TradingView is unable to display high multiplier values combined with large period SMAs. For example, you won't be able to see 200 period SMAs with a multiplier of 20. This is a cap set by TradingView that errors out when it has been exceeded.
סקריפט מוגן
סקריפט זה פורסם כמקור סגור. עם זאת, תוכל להשתמש בו בחופשיות וללא כל מגבלות – למד עוד כאן
כתב ויתור
המידע והפרסומים אינם מיועדים להיות, ואינם מהווים, ייעוץ או המלצה פיננסית, השקעתית, מסחרית או מכל סוג אחר המסופקת או מאושרת על ידי TradingView. קרא עוד ב־תנאי השימוש.
סקריפט מוגן
סקריפט זה פורסם כמקור סגור. עם זאת, תוכל להשתמש בו בחופשיות וללא כל מגבלות – למד עוד כאן
כתב ויתור
המידע והפרסומים אינם מיועדים להיות, ואינם מהווים, ייעוץ או המלצה פיננסית, השקעתית, מסחרית או מכל סוג אחר המסופקת או מאושרת על ידי TradingView. קרא עוד ב־תנאי השימוש.