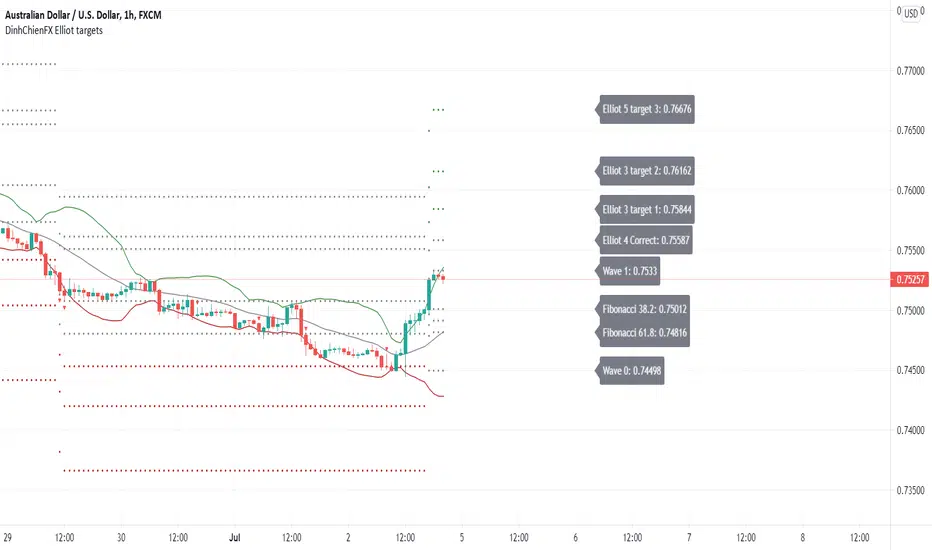
DinhChienFX Elliot targets 1.1

I present my new Elliot targets script.
Anyone learning the Elliot wave is very difficult and difficult to understand.
I would like to take a few parts of the Elliot wave theory that is how to calculate the retracement area
and price levels according to the Fibonacci ratio of the Elliot wave. A Then combine the basic indicators Bollinger Band, MACD-H and RSI
to predict the future of the market. And try to automate the above.
The idea in the Elliot targets scenario is to combine:
+ Oscillators indicator (Rsi - Relative Strength Index)
+ Center Oscillators indicator (MACD - Moving Average convergence Divergence)
+ Volatility indicator (BB - Bollinger Band).
There are some option in the script, let see:
- Bollinger Band: calculates trend with signal combination from Bollinger Band indicator.
- RSI: calculates trend with signal combination from RSI.
- MACD: Main indicator of Elliot targets script, with option Histogram highest or lowest
in a week, a month, quarter, year depending on timeframe H1, H4 or Daily... I will show with pictures following photo.
- Label: Option to display the price notice board:
1 - Main bulletins board (default: off): showing all prices at Fibonacci levels (38.2, 50, 61.8, 161.8, 200, 261.8).
2 - Separate bulletin board for 2 trends (up - down): current price at Fibonacci levels (38.2, 50, 61.8, 161.8, 200, 261.8).
- Generate Alerts: 1. Uptrend triggered. 2. Downtrend activated.
Here are a few examples of how the editor uses the above indicators to predict goals:
- The signal is with only MACD:
- The signals combine MACD and Bollinger Band:
- The signals combine MACD and RSI:
- The signals combine MACD + Bollinger band + RSI:
* The label shows:
- Main label is at Uptrend:
- Main label is at Downtrend:
- The separate labels is at Uptrend:
- The separate labels is at Downtrend:
סקריפט להזמנה בלבד
רק משתמשים שאושרו על ידי המחבר יכולים לגשת לסקריפט הזה. תצטרך לבקש ולקבל אישור להשתמש בו. אישור זה ניתן בדרך כלל לאחר תשלום. לפרטים נוספים, בצע את ההוראות של המחבר למטה או צור קשר ישירות עם dinhchien.
TradingView לא ממליצה לשלם עבור סקריפט או להשתמש בו, אלא אם כן אתה סומך לחלוטין על המחבר שלו ומבין איך הוא עובד. ייתכן שתמצא גם אלטרנטיבות חינמיות בקוד פתוח בסקריפטים של הקהילה שלנו.
הוראות המחבר
כתב ויתור
סקריפט להזמנה בלבד
רק משתמשים שאושרו על ידי המחבר יכולים לגשת לסקריפט הזה. תצטרך לבקש ולקבל אישור להשתמש בו. אישור זה ניתן בדרך כלל לאחר תשלום. לפרטים נוספים, בצע את ההוראות של המחבר למטה או צור קשר ישירות עם dinhchien.
TradingView לא ממליצה לשלם עבור סקריפט או להשתמש בו, אלא אם כן אתה סומך לחלוטין על המחבר שלו ומבין איך הוא עובד. ייתכן שתמצא גם אלטרנטיבות חינמיות בקוד פתוח בסקריפטים של הקהילה שלנו.