OPEN-SOURCE SCRIPT
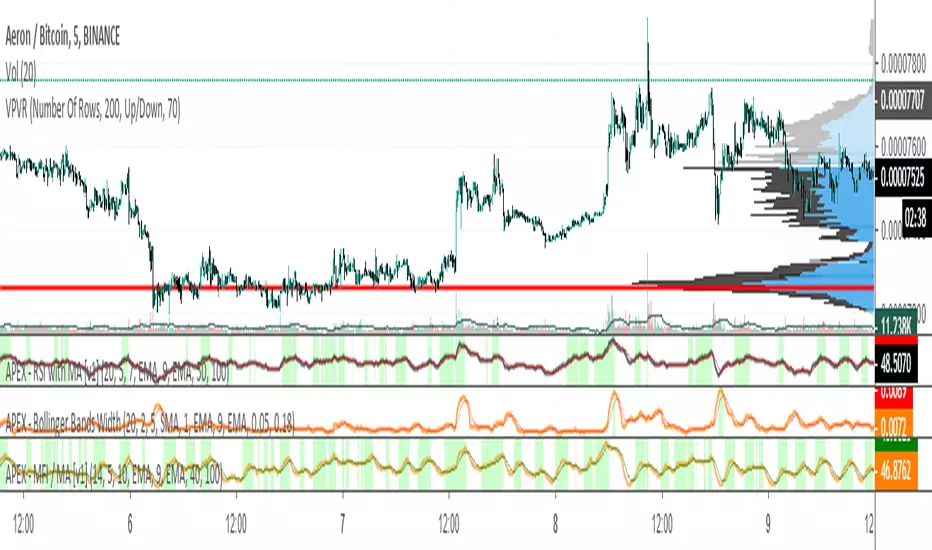
APEX - MFI / MA [v1]

The Money Flow Index is a volume indicator used for measuring buying and selling pressure. This is done by analyzing both price and volume. The MFI's calculation generates a value that is then plotted as a line that moves within a range of 0-100, making it an oscillator. When the MFI rises, this indicates an increase in buying pressure. When it falls, this indicates an increase in selling pressure. The Money Flow Index can generate several signals, most notably; overbought and oversold conditions and divergences.
You are also able to add addition smoothing and or a moving average on top of the MFI. This can help you trade only areas with increasing buying pressure.
You are also able to add addition smoothing and or a moving average on top of the MFI. This can help you trade only areas with increasing buying pressure.
סקריפט קוד פתוח
ברוח האמיתית של TradingView, יוצר הסקריפט הזה הפך אותו לקוד פתוח, כך שסוחרים יוכלו לעיין בו ולאמת את פעולתו. כל הכבוד למחבר! אמנם ניתן להשתמש בו בחינם, אך זכור כי פרסום חוזר של הקוד כפוף ל־כללי הבית שלנו.
כתב ויתור
המידע והפרסומים אינם מיועדים להיות, ואינם מהווים, ייעוץ או המלצה פיננסית, השקעתית, מסחרית או מכל סוג אחר המסופקת או מאושרת על ידי TradingView. קרא עוד ב־תנאי השימוש.