OPEN-SOURCE SCRIPT
מעודכן USD Market Liquidity [tedtalksmacro]

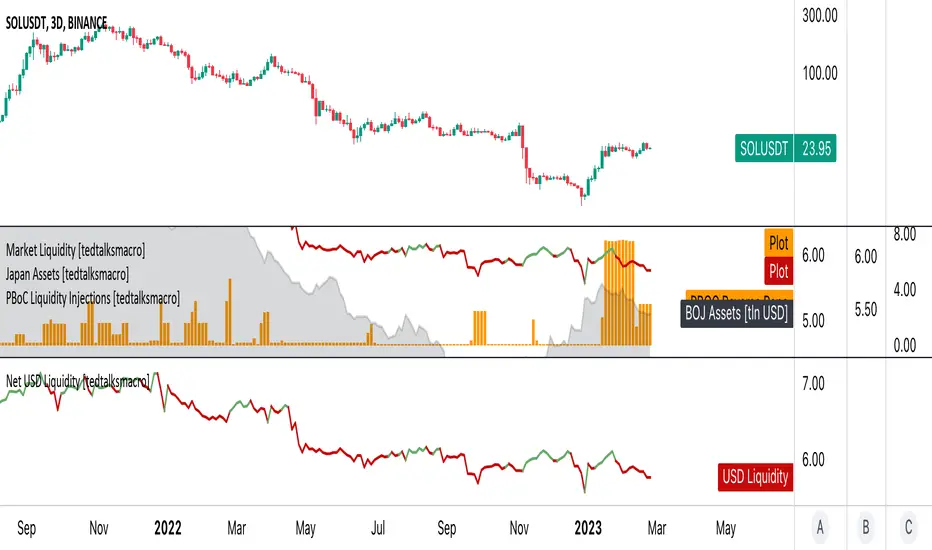
This script aggregates and analyses total USD market liquidity in trillions of dollars - albeit with lagged, weekly data (live data is not available in TradingView!)
There's a positive correlation with the total liquidity available in the world's largest economy and risk assets like BTCUSD
The formula for net liquidity is as follows and uses account balances at the Fed and of the Treasury's General Account:
Fed Balance Sheet USBBS — Accepted Reverse Repo Bids
  RRPONTTLD — Treasury General Account Balance
  WTREGEN
This script shows positive prints when liquidity is above it's 7 day EMA and negative when below... don't use this on timeframes lower than the 1D chart!
There's a positive correlation with the total liquidity available in the world's largest economy and risk assets like
The formula for net liquidity is as follows and uses account balances at the Fed and of the Treasury's General Account:
Fed Balance Sheet
This script shows positive prints when liquidity is above it's 7 day EMA and negative when below... don't use this on timeframes lower than the 1D chart!
הערות שחרור
Overlay changed to false.הערות שחרור
name updatedהערות שחרור
plot titles updatedסקריפט קוד פתוח
ברוח האמיתית של TradingView, יוצר הסקריפט הזה הפך אותו לקוד פתוח, כך שסוחרים יוכלו לעיין בו ולאמת את פעולתו. כל הכבוד למחבר! אמנם ניתן להשתמש בו בחינם, אך זכור כי פרסום חוזר של הקוד כפוף ל־כללי הבית שלנו.
כתב ויתור
המידע והפרסומים אינם מיועדים להיות, ואינם מהווים, ייעוץ או המלצה פיננסית, השקעתית, מסחרית או מכל סוג אחר המסופקת או מאושרת על ידי TradingView. קרא עוד ב־תנאי השימוש.
סקריפט קוד פתוח
ברוח האמיתית של TradingView, יוצר הסקריפט הזה הפך אותו לקוד פתוח, כך שסוחרים יוכלו לעיין בו ולאמת את פעולתו. כל הכבוד למחבר! אמנם ניתן להשתמש בו בחינם, אך זכור כי פרסום חוזר של הקוד כפוף ל־כללי הבית שלנו.
כתב ויתור
המידע והפרסומים אינם מיועדים להיות, ואינם מהווים, ייעוץ או המלצה פיננסית, השקעתית, מסחרית או מכל סוג אחר המסופקת או מאושרת על ידי TradingView. קרא עוד ב־תנאי השימוש.