OPEN-SOURCE SCRIPT
VWAP angle
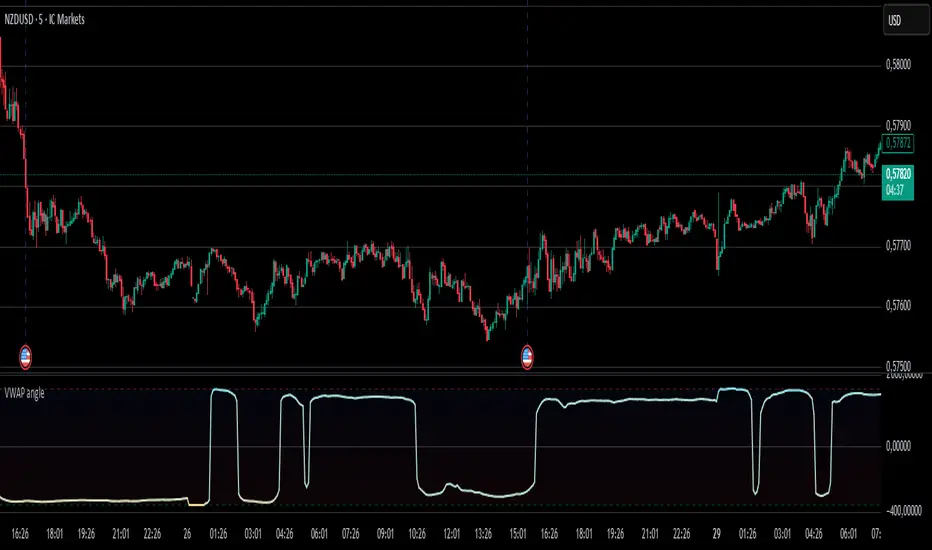
VWAP Angle Indicator
The VWAP Angle indicator is a technical analysis tool designed to measure the directional momentum of the Volume Weighted Average Price (VWAP). Rather than simply plotting the VWAP line itself, this indicator calculates the angle of the VWAP's trajectory over a specified lookback period. It converts the slope into degrees using arctangent mathematics, normalized by the Average True Range (ATR) to account for price volatility. The result is a momentum oscillator that ranges from -100 to +100, providing traders with a clear visual representation of whether the VWAP is trending sharply upward, downward, or moving sideways.
The indicator features customizable overbought and oversold zones (defaulting to +65 and -65 respectively) with color-coded bands to help identify potential reversal points or extreme market conditions. A dynamic color gradient transitions from cyan (bullish angles) to orange (bearish angles), making it easy to spot trend changes at a glance. The visualization includes multiple threshold bands at ±65 and ±80 levels, with shaded regions that intensify as the angle reaches extreme values, helping traders identify when momentum may be overextended.
Built-in alert functionality notifies traders when the VWAP angle crosses into overbought or oversold territories, with optional visual labels appearing directly on the indicator panel. This makes it particularly useful for automated trading strategies or for traders who want real-time notifications of potential trend exhaustion or reversal setups. The indicator works best when combined with other technical tools to confirm signals and filter out false alerts during choppy or ranging market conditions.
סקריפט קוד פתוח
ברוח TradingView אמיתית, היוצר של הסקריפט הזה הפך אותו לקוד פתוח, כך שסוחרים יכולים לבדוק ולאמת את הפונקציונליות שלו. כל הכבוד למחבר! למרות שאתה יכול להשתמש בו בחינם, זכור שפרסום מחדש של הקוד כפוף לכללי הבית שלנו.
כתב ויתור
המידע והפרסומים אינם אמורים להיות, ואינם מהווים, עצות פיננסיות, השקעות, מסחר או סוגים אחרים של עצות או המלצות שסופקו או מאושרים על ידי TradingView. קרא עוד בתנאים וההגבלות.