OPEN-SOURCE SCRIPT
מעודכן Crypto/Stable Mcap Ratio Normalized
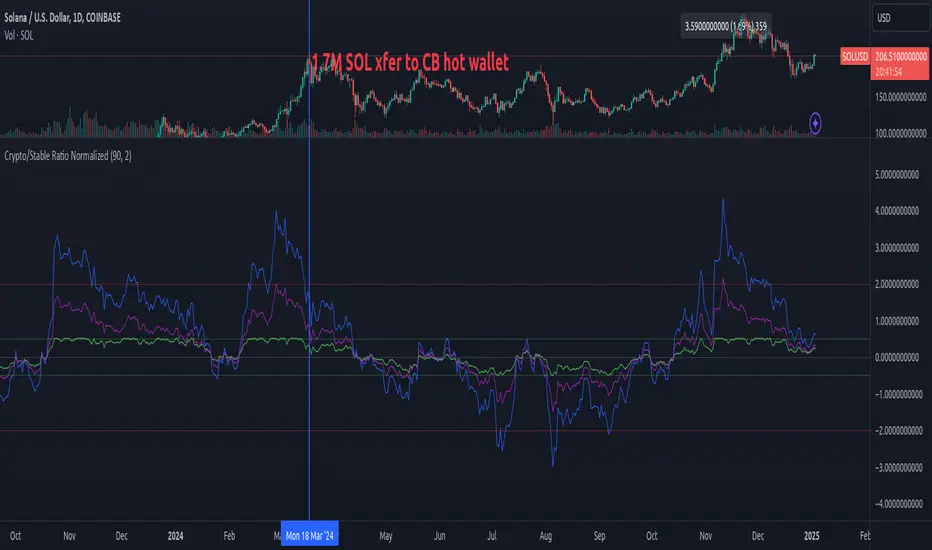
Create a normalized ratio of total crypto market cap to stablecoin supply (USDT + USDC + DAI). Idea is to create a reference point for the total market cap's position, relative to total "dollars" in the crypto ecosystem. It's an imperfect metric, but potentially helpful. V0.1.
This script provides four different normalization methods:
Z-Score Normalization:
Min-Max Normalization:
Percent of All-Time Range:
Bollinger Band Position:
Features:
This script provides four different normalization methods:
Z-Score Normalization:
- Shows how many standard deviations the ratio is from its mean
- Good for identifying extreme values
- Mean-reverting properties
Min-Max Normalization:
- Scales values between 0 and 1
- Good for relative position within recent range
- More sensitive to recent changes
Percent of All-Time Range:
- Shows where current ratio is relative to all-time highs/lows
- Good for historical context
- Less sensitive to recent changes
Bollinger Band Position:
- Similar to z-score but with adjustable sensitivity
- Good for trading signals
- Can be tuned via standard deviation multiplier
Features:
- Adjustable lookback period
- Reference bands for overbought/oversold levels
- Built-in alerts for extreme values
- Color-coded plots for easy visualization
הערות שחרור
Create a normalized ratio of total crypto market cap to stablecoin supply (USDT + USDC + DAI). Idea is to create a reference point for the total market cap's position, relative to total "dollars" in the crypto ecosystem. It's an imperfect metric, but potentially helpful. V0.1.This script provides four different normalization methods:
Z-Score Normalization:
- Shows how many standard deviations the ratio is from its mean
- Good for identifying extreme values
- Mean-reverting properties
Min-Max Normalization:
- Scales values between 0 and 1
- Good for relative position within recent range
- More sensitive to recent changes
Percent of All-Time Range:
- Shows where current ratio is relative to all-time highs/lows
- Good for historical context
- Less sensitive to recent changes
Bollinger Band Position:
- Similar to z-score but with adjustable sensitivity
- Good for trading signals
- Can be tuned via standard deviation multiplier
Features:
- Adjustable lookback period
- Reference bands for overbought/oversold levels
- Built-in alerts for extreme values
- Color-coded plots for easy visualization
סקריפט קוד פתוח
ברוח האמיתית של TradingView, יוצר הסקריפט הזה הפך אותו לקוד פתוח, כך שסוחרים יוכלו לעיין בו ולאמת את פעולתו. כל הכבוד למחבר! אמנם ניתן להשתמש בו בחינם, אך זכור כי פרסום חוזר של הקוד כפוף ל־כללי הבית שלנו.
כתב ויתור
המידע והפרסומים אינם מיועדים להיות, ואינם מהווים, ייעוץ או המלצה פיננסית, השקעתית, מסחרית או מכל סוג אחר המסופקת או מאושרת על ידי TradingView. קרא עוד ב־תנאי השימוש.