OPEN-SOURCE SCRIPT
LBR-S310ROC @shrilss

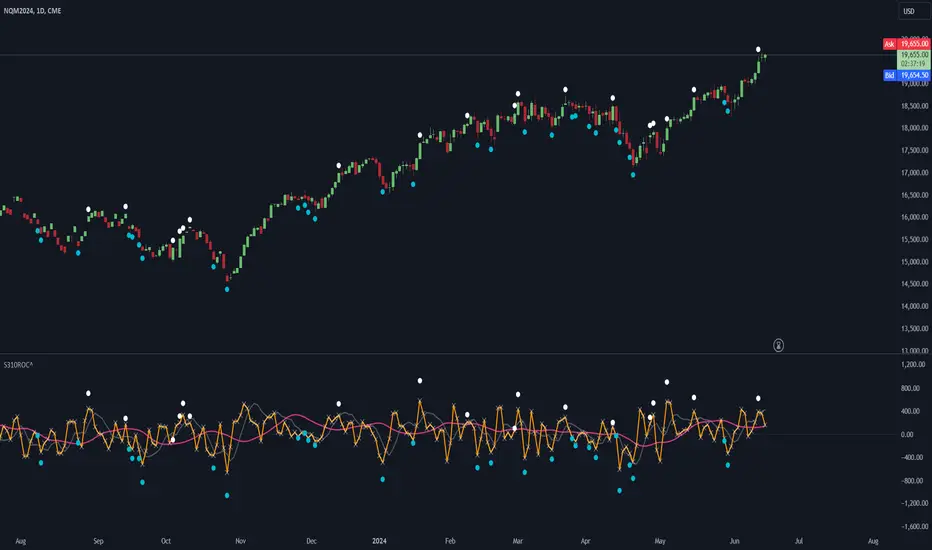
Originally made by Linda Raschke, The S310ROC Indicator combines the Rate of Change (ROC) indicator with the 3-10 Oscillator (Modified MACD) and plots to capture rapid price movements and gauge market momentum.
- Rate of Change (ROC): This component of the indicator measures the percentage change in price over a specified short interval, which can be set by the user (default is 2 days). It is calculated by subtracting the closing price from 'X' days ago from the current close.
- 3-10 Oscillator (MACD; 3,10,16): This is a specialized version of the Moving Average Convergence Divergence (MACD) but uses simple moving averages instead of exponential. Using a fast moving average of 3 days and a slow moving average of 10 days with a smoothing period of 16.
- ROC Dots: A great feature based on the oscillator's readings. Dots are displayed directly on the oscillator or the price chart to provide visual momentum cues:
- Aqua Dots: Appear when all lines (ROC, MACD, Slowline) are sloping downwards, indicating bearish momentum and potentially signaling a sell opportunity.
- White Dots: Appear when all lines are sloping upwards, suggesting bullish momentum and possibly a buy signal.
סקריפט קוד פתוח
ברוח האמיתית של TradingView, יוצר הסקריפט הזה הפך אותו לקוד פתוח, כך שסוחרים יוכלו לעיין בו ולאמת את פעולתו. כל הכבוד למחבר! אמנם ניתן להשתמש בו בחינם, אך זכור כי פרסום חוזר של הקוד כפוף ל־כללי הבית שלנו.
כתב ויתור
המידע והפרסומים אינם מיועדים להיות, ואינם מהווים, ייעוץ או המלצה פיננסית, השקעתית, מסחרית או מכל סוג אחר המסופקת או מאושרת על ידי TradingView. קרא עוד ב־תנאי השימוש.