PROTECTED SOURCE SCRIPT
WaveViewer
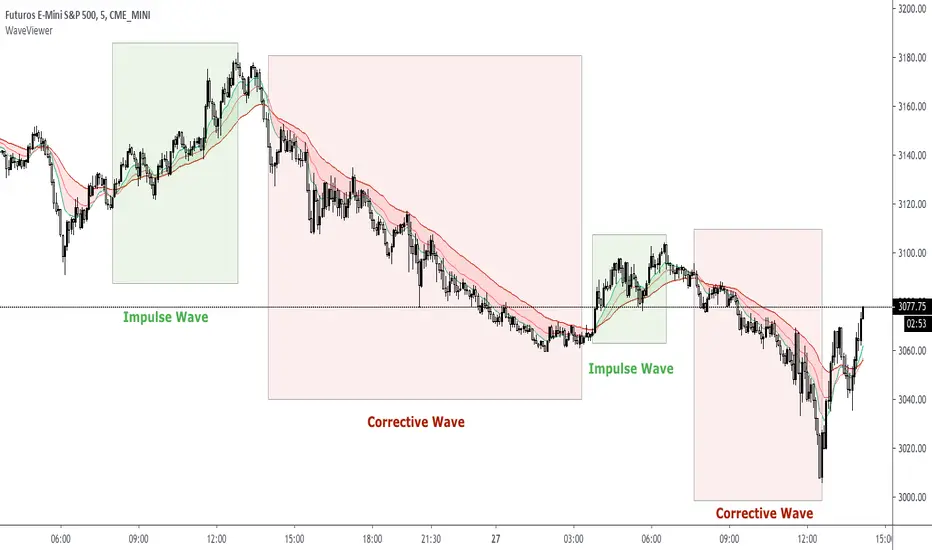
WaveViewer impulsive and corrective wave viewer indicator
The market is developed by making impulsive wave movements and corrective waves thus forming a "V" type fractal
This indicator allows you to easily visualize these movements to make buying or selling decisions
WaveViewer is an indicator that allows the identification of impulsive waves visually through EMAs crossings
Visually facilitates the green color for the impulsive wave and red for the corrective wave
NOTE 1: This indicator should be complemented with the 1-9 fractal counter
NOTE 2: WaveViewer recommended for instrument ES1 ( SP500 ) with timeframe 5 minutes
סקריפט מוגן
סקריפט זה פורסם כמקור סגור. עם זאת, תוכל להשתמש בו בחופשיות וללא כל מגבלות – למד עוד כאן
כתב ויתור
המידע והפרסומים אינם מיועדים להיות, ואינם מהווים, ייעוץ או המלצה פיננסית, השקעתית, מסחרית או מכל סוג אחר המסופקת או מאושרת על ידי TradingView. קרא עוד ב־תנאי השימוש.
סקריפט מוגן
סקריפט זה פורסם כמקור סגור. עם זאת, תוכל להשתמש בו בחופשיות וללא כל מגבלות – למד עוד כאן
כתב ויתור
המידע והפרסומים אינם מיועדים להיות, ואינם מהווים, ייעוץ או המלצה פיננסית, השקעתית, מסחרית או מכל סוג אחר המסופקת או מאושרת על ידי TradingView. קרא עוד ב־תנאי השימוש.