OPEN-SOURCE SCRIPT
מעודכן Volume Points of Control and No Control [NariCapitalTrading]
Overview:
The "Volume Points of Control and No Control" (VPOC/VPONC) is a trading indicator/concept I designed to identify key price levels based on volume activity. It shows (on the price label on the y-axis) where there was the most (red) and the least (blue) volume over a specified lookback period. Read below for interpretation.
Key Features:
Inputs and Calculations:
Indicator Usage:
Chart Representation:
The "Volume Points of Control and No Control" (VPOC/VPONC) is a trading indicator/concept I designed to identify key price levels based on volume activity. It shows (on the price label on the y-axis) where there was the most (red) and the least (blue) volume over a specified lookback period. Read below for interpretation.
Key Features:
- [] Identifies key price levels based on volume
[] Customizable lookback period and trade timeframe - Plots Volume Point of Control (VPOC) and Volume Point of No Control (VPONC)
Inputs and Calculations:
Custom Trade Timeframe: Allows users to set the desired timeframe for analysis (e.g., Daily, Weekly).
Lookback Period: Users can specify the period over which to analyze volume data.
VPOC Calculation: Determines the price level with the highest volume within the lookback period.
VPONC Calculation: Finds the price level with the lowest volume within the lookback period.
Indicator Usage:
The VPOC is considered a significant level where traders have shown the most interest, often acting as a strong support or resistance level. The VPONC, conversely, is a concept I made up. It represents a price level where 1) in an trending market, this price was accepted quickly, thus suggesting continuation of an trend. 2) price retracements will typically revisit thinly-traded price areas, the VPONC can sometimes signal an area of support in a downtrend.
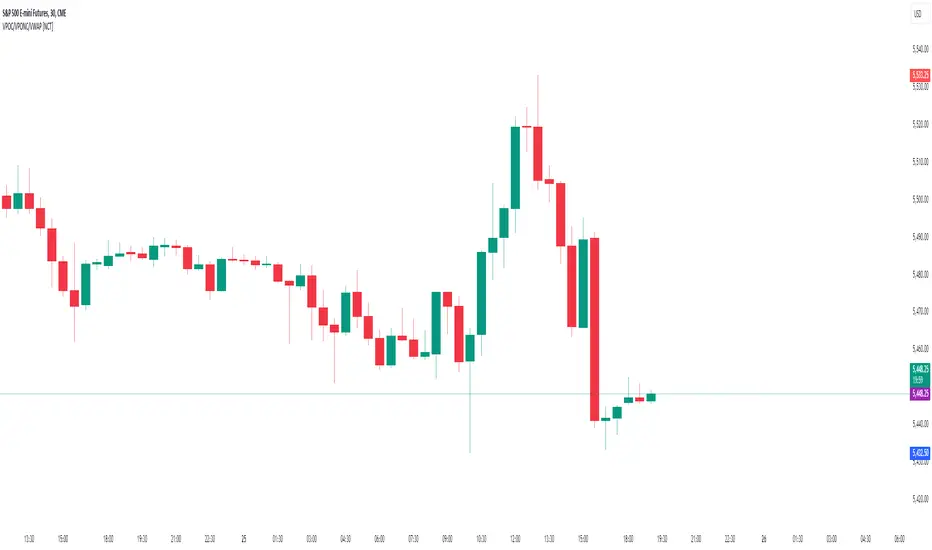
Chart Representation:
VPOC Label: Plotted on the y-axis in red, indicating the price level with the highest volume.
VPONC Label: Displayed on the y-axis in blue, showing the price level with the least volume.
These labels are dynamically updated based on the user-specified lookback period and trade timeframe.
הערות שחרור
Cleaned-up one commentהערות שחרור
Name update for consistencyהערות שחרור
Summary of Changes:1. Inclusion of VWAP Calculation:
The new code introduces a VWAP (Volume Weighted Average Price) calculation based on a customizable timeframe. This enhances the original indicator by providing an additional key price level used for trend analysis.
2. Customizable VWAP Timeframe:
An input field for selecting the VWAP timeframe has been added. This allows users to adjust the VWAP calculation to their preferred timeframe, offering greater flexibility in analysis.
3. Dynamic Lookback Period for VPOC and VPONC:
The original fixed lookback period for calculating the Volume Point of Control (VPOC) and Volume Point of No Control (VPONC) has been replaced with a dynamically adjustable period. This dynamic adjustment is based on market volatility, providing a more responsive and accurate measure of significant volume levels.
4. Enhanced Security Requests:
The new code makes use of the request.security function to accurately fetch historical volume and close data within the specified timeframe. This ensures that VPOC and VPONC calculations are based on precise and relevant data.
5. Improved Plot Visibility and Styling:
Initially, the lines for VPOC, VPONC, and VWAP are plotted with full transparency, making them invisible on the chart. Labels are used to denote these levels, ensuring a cleaner and less cluttered visual representation.
6. Addition of Labels for Key Levels:
Labels for VPOC, VPONC, and VWAP are added to the chart, providing clear and direct annotation of these critical price levels.
7. Alert Conditions for Crossings:
The new code sets up alert conditions for when the price crosses the VPOC or VPONC levels. This feature ensures traders are notified of significant market movements relative to these critical volume points.
Conclusion:
The enhanced script builds on the original by adding VWAP calculation with customizable timeframes, improving the responsiveness of VPOC and VPONC calculations through dynamic lookback periods, and refining the visual representation with clear labels and alerts. These improvements are designed to provide more accurate and actionable insights.
סקריפט קוד פתוח
ברוח האמיתית של TradingView, יוצר הסקריפט הזה הפך אותו לקוד פתוח, כך שסוחרים יוכלו לעיין בו ולאמת את פעולתו. כל הכבוד למחבר! אמנם ניתן להשתמש בו בחינם, אך זכור כי פרסום חוזר של הקוד כפוף ל־כללי הבית שלנו.
כתב ויתור
המידע והפרסומים אינם מיועדים להיות, ואינם מהווים, ייעוץ או המלצה פיננסית, השקעתית, מסחרית או מכל סוג אחר המסופקת או מאושרת על ידי TradingView. קרא עוד ב־תנאי השימוש.