OPEN-SOURCE SCRIPT
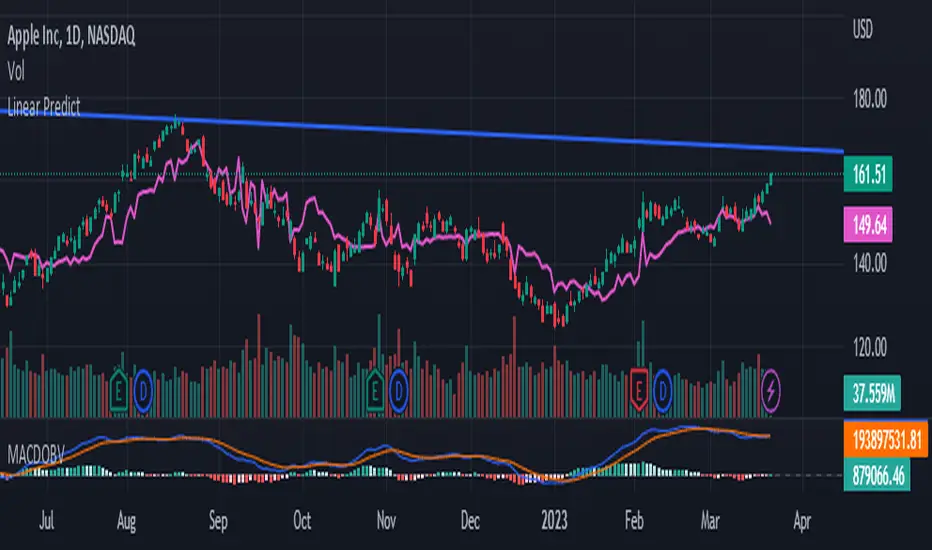
Linear Regress on Price And Volume

Linear regression is a statistical method used to model the relationship between a dependent variable and one or more independent variables. It assumes a linear relationship between the dependent variable and the independent variable(s) and attempts to fit a straight line that best describes the relationship.
In the context of predicting the price of a stock based on the volume, we can use linear regression to build a model that relates the price of the stock (dependent variable) to the volume (independent variable). The idea is to use lookback period to predict future prices based on the volume.
To build this indicator, we start by collecting data on the price of the stock and the volume over a selected of time or by default 21 days. We then plot the data on a scatter plot with the volume on the x-axis and the price on the y-axis. If there is a clear pattern in the data, we can fit a straight line to the data using a method called least squares regression. The line represents the best linear approximation of the relationship between the price and the volume.
Once we have the line, we can use it to make predictions. For example, if we observe a certain volume, we can use the line to estimate the corresponding price.
It's worth noting that linear regression assumes a linear relationship between the variables. In reality, the relationship between the price and the volume may be more complex, and other factors may also influence the price of the stock. Therefore, while linear regression can be a useful tool, it should be used in conjunction with other methods and should be interpreted with caution.
סקריפט קוד פתוח
ברוח האמיתית של TradingView, יוצר הסקריפט הזה הפך אותו לקוד פתוח, כך שסוחרים יוכלו לעיין בו ולאמת את פעולתו. כל הכבוד למחבר! אמנם ניתן להשתמש בו בחינם, אך זכור כי פרסום חוזר של הקוד כפוף ל־כללי הבית שלנו.
כתב ויתור
המידע והפרסומים אינם מיועדים להיות, ואינם מהווים, ייעוץ או המלצה פיננסית, השקעתית, מסחרית או מכל סוג אחר המסופקת או מאושרת על ידי TradingView. קרא עוד ב־תנאי השימוש.