PROTECTED SOURCE SCRIPT
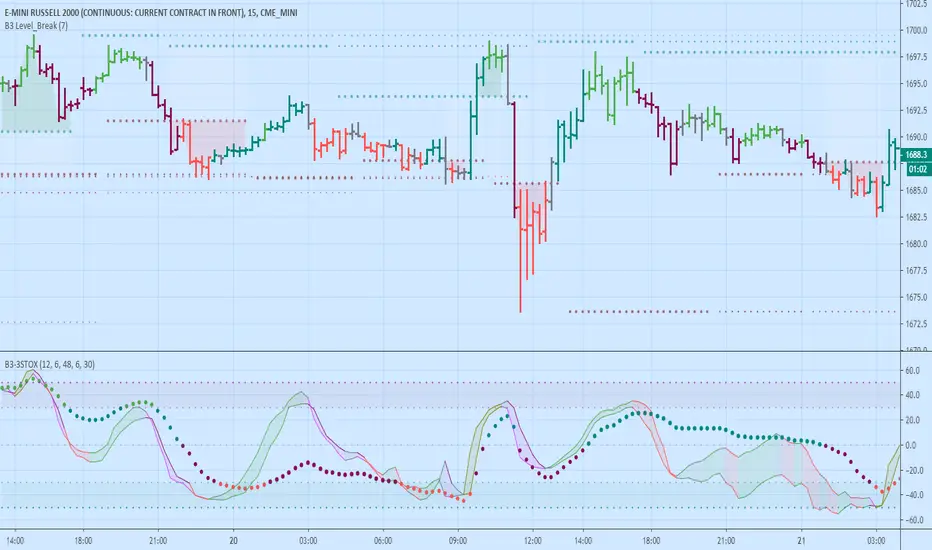
B3 3-Stox - Scalping Oscillator

This is an indicator that combines what I see some scalpers use on youtube videos and webinars.
3 Stox = Three Stochastic Readings
Bar Color Code
Fast Line Color Code
Trades to be looked at:
Things to note:
More details: https://drive.google.com/open?id=1PzJ9K4uMcgbUBNUd6Kxqom9Qrp7txj8Q
Enjoy!
~ B3 d^.^b
3 Stox = Three Stochastic Readings
- Fast Stochastic of Highs
- Fast Stochastic of Lows
- Slow Stochastic of Bar Average
Bar Color Code
- Bar Color Coded
- Light Green = Long with trend
- Dark Green = Long counter trend
- Light Red = Short with trend
- Dark Red = Short counter trend
Fast Line Color Code
- Green = Lows leading highs up (Organized Rise)
- Olive = Highs leading lows up (Rapid Rise)
- Red = Highs leading lows down (Organized Fall)
- Fuchsia = Lows leading lows down (Rapid Fall)
Trades to be looked at:
- Trading in the direction of the fast lines, when they are similar to and near one another, in the same direction as the Slow stochastic line's color or slope
- Trading Long Fastline green color when all 3 lines are oversold
- Trading Short Fastline red color when all 3 lines are overbought
- AVOID Trading when fast lines are spread out and a large cloud appears between them (Chop Filter)
- Look for solid up & down & up & etc. oscillation or you can use the slow line to find trends to trade
- Green and red fast lines are organized moves, the olive and purple lines are faster moves and harder to lock in sometimes
Things to note:
- Pairs nicely with a level printing study like B3 Level Break (applied on above chart)
- There are 2 color schemes for the Fast High and Low Stochastic lines, and 2 color schemes for the bars
- In this script the bar average is defined as (open+high+low+close+close[1]) / 5, keep the slow line at a large length input so that you can get a macro trend reading without zooming out the chart
- The Extended Stochastics from one of my previous scripts is defaulted as the style used, however, you may turn that feature off and use the classic Stochastics [url=]


More details: https://drive.google.com/open?id=1PzJ9K4uMcgbUBNUd6Kxqom9Qrp7txj8Q
Enjoy!
~ B3 d^.^b
סקריפט מוגן
סקריפט זה פורסם כמקור סגור. עם זאת, תוכל להשתמש בו בחופשיות וללא כל מגבלות – למד עוד כאן
כתב ויתור
המידע והפרסומים אינם מיועדים להיות, ואינם מהווים, ייעוץ או המלצה פיננסית, השקעתית, מסחרית או מכל סוג אחר המסופקת או מאושרת על ידי TradingView. קרא עוד ב־תנאי השימוש.
סקריפט מוגן
סקריפט זה פורסם כמקור סגור. עם זאת, תוכל להשתמש בו בחופשיות וללא כל מגבלות – למד עוד כאן
כתב ויתור
המידע והפרסומים אינם מיועדים להיות, ואינם מהווים, ייעוץ או המלצה פיננסית, השקעתית, מסחרית או מכל סוג אחר המסופקת או מאושרת על ידי TradingView. קרא עוד ב־תנאי השימוש.