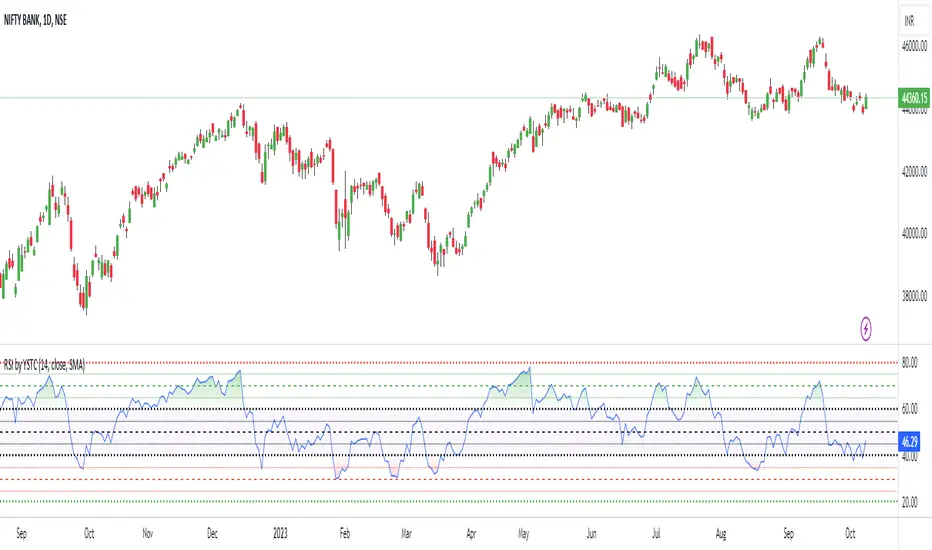
Relative Strength Index by YSTC
According to payment you will either get a TradingView account with indicators activated or
Have to send an email to contact@ystc.in with the email you used to sign up with us, and with your TradingView Username.
The script is available (for free) to YSTC's Course members of "Trading with PAV".
Relative Strength Index (RSI)
A momentum based oscillator which is used to measure the speed (velocity) as well as the change (magnitude) of directional price movements.
What Different about this RSI by YSTC.
You get Support and Resistance lines for RSI which are 20, 30, 40, 50, 60, 70, 80. as shown below.
It can also show RSI Candles as shown below.
For those who want all types of MA with MA Cross can play with this indicator. Below is MA Cross of 9, 21.
And for NEW user with untrained eyes who cant yet detect Divergence this indicator Saves you the trouble of finding.
Below is Regular Bullish and Bearish Divergence. Linewidth 2.
Below is Hidden Bullish and Bearish Divergence. Linewidth 1.
You can add this script to your chart by clicking "Add to favorite indicators" below.
Have Questions ?
contact@ystc.in
Free Stock Market Introduction Available.
Name: Yogesh Patil (YS Trading Coach).
Contact: +91 9637070868.
Time: Monday to Friday (10:00 AM - 07:00 PM).
סקריפט להזמנה בלבד
רק משתמשים שאושרו על ידי המחבר יכולים לגשת לסקריפט הזה. יהיה עליך לשלוח בקשת גישה ולקבל אישור לשימוש. בדרך כלל, הגישה ניתנת לאחר תשלום. למידע נוסף, עקוב אחר ההוראות של היוצר בהמשך או צור קשר עם YSTradingCoach ישירות.
שים לב שסקריפט פרטי זה, המוזמן בלבד, לא נבדק על ידי מנהלי סקריפטים, ועמידתו בכללי הבית לא נקבעה. TradingView לא ממליצה לשלם עבור סקריפט או להשתמש בו אלא אם כן אתה סומך לחלוטין על המחבר שלו ומבין כיצד הוא פועל. ייתכן שתוכל גם למצוא חלופות חינמיות וקוד פתוח ב-סקריפטים הקהילתיים שלנו.
הוראות המחבר
כתב ויתור
סקריפט להזמנה בלבד
רק משתמשים שאושרו על ידי המחבר יכולים לגשת לסקריפט הזה. יהיה עליך לשלוח בקשת גישה ולקבל אישור לשימוש. בדרך כלל, הגישה ניתנת לאחר תשלום. למידע נוסף, עקוב אחר ההוראות של היוצר בהמשך או צור קשר עם YSTradingCoach ישירות.
שים לב שסקריפט פרטי זה, המוזמן בלבד, לא נבדק על ידי מנהלי סקריפטים, ועמידתו בכללי הבית לא נקבעה. TradingView לא ממליצה לשלם עבור סקריפט או להשתמש בו אלא אם כן אתה סומך לחלוטין על המחבר שלו ומבין כיצד הוא פועל. ייתכן שתוכל גם למצוא חלופות חינמיות וקוד פתוח ב-סקריפטים הקהילתיים שלנו.