KD_RSI345
Modified: 2/12/2017
Description:
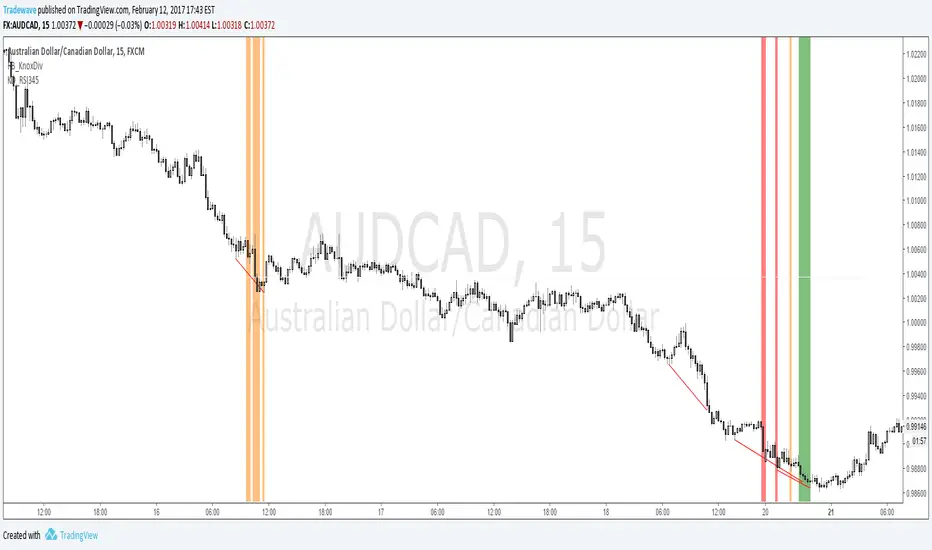
The indicator searches for instances where there is a Knoxville divergence combined with multiple time frame RSI Oversold/Overbought conditions.
When a bullish Knoxville Divergence (KD) is present and price is oversold across 3 time frames, within the KD bar range, a vertical green line is displayed on the chart.
When a bullish Knoxville Divergence (KD) is present and price is oversold across 4 time frames, within the KD bar range, a vertical orange line is displayed on the chart.
When a bullish Knoxville Divergence (KD) is present and price is oversold across 3 time frames, within the KD bar range, a vertical red line is displayed on the chart.
Same applies for Bearish Knoxville Divergence in overbought conditions.
סקריפט להזמנה בלבד
רק משתמשים שאושרו על ידי המחבר יכולים לגשת לסקריפט הזה. יהיה עליך לשלוח בקשת גישה ולקבל אישור לשימוש. בדרך כלל, הגישה ניתנת לאחר תשלום. למידע נוסף, עקוב אחר ההוראות של היוצר בהמשך או צור קשר עם LiquidityTracker ישירות.
TradingView לא ממליצה לשלם עבור סקריפט או להשתמש בו אלא אם כן אתה סומך לחלוטין על המחבר שלו ומבין כיצד הוא פועל. ייתכן שתוכל גם למצוא חלופות חינמיות וקוד פתוח ב-סקריפטים הקהילתיים שלנו.
הוראות המחבר
כתב ויתור
סקריפט להזמנה בלבד
רק משתמשים שאושרו על ידי המחבר יכולים לגשת לסקריפט הזה. יהיה עליך לשלוח בקשת גישה ולקבל אישור לשימוש. בדרך כלל, הגישה ניתנת לאחר תשלום. למידע נוסף, עקוב אחר ההוראות של היוצר בהמשך או צור קשר עם LiquidityTracker ישירות.
TradingView לא ממליצה לשלם עבור סקריפט או להשתמש בו אלא אם כן אתה סומך לחלוטין על המחבר שלו ומבין כיצד הוא פועל. ייתכן שתוכל גם למצוא חלופות חינמיות וקוד פתוח ב-סקריפטים הקהילתיים שלנו.