OPEN-SOURCE SCRIPT
Up vs Down Volume Compared to Price
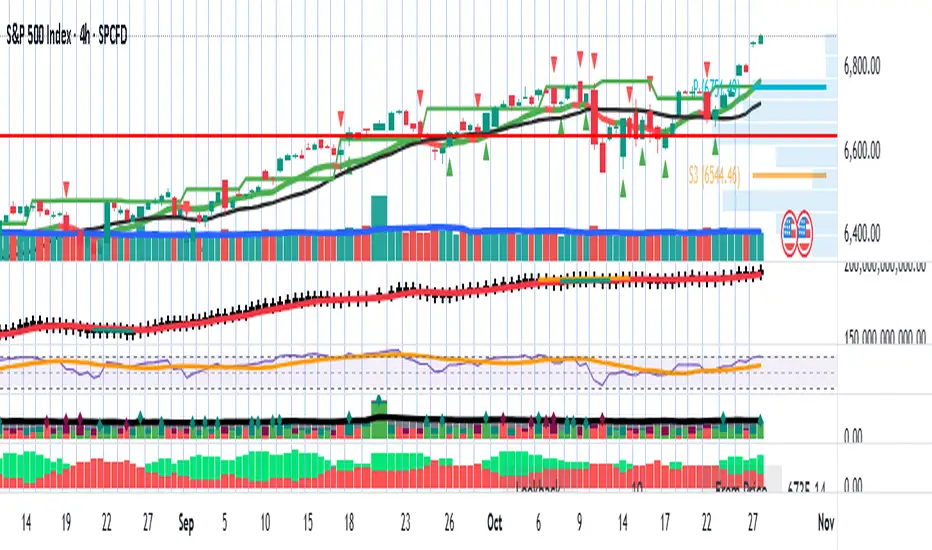
Hi team,
I’ve put together a simple TradingView indicator that breaks down the last N candles into up-moves and down-moves, showing how much volume supported each side. It helps you quickly see whether the market is rallying on strong participation or just drifting higher on weak volume.
The tool tracks total up-volume versus down-volume, compares their ratios, and flags when pullbacks are happening with noticeably lower volume than the prior push up — a setup that often signals a healthy continuation rather than a reversal.
It also shows key metrics like total volume, price change, and up/down ratios directly on the chart for quick assessment. You’ll instantly know if you’re looking at a light-volume pullback or a heavy-volume sell-off.
Let’s test it out across a few symbols and discuss any tweaks we’d like — maybe layering an EMA or VWAP filter for cleaner trend confirmation.
סקריפט קוד פתוח
ברוח האמיתית של TradingView, יוצר הסקריפט הזה הפך אותו לקוד פתוח, כך שסוחרים יוכלו לעיין בו ולאמת את פעולתו. כל הכבוד למחבר! אמנם ניתן להשתמש בו בחינם, אך זכור כי פרסום חוזר של הקוד כפוף ל־כללי הבית שלנו.
כתב ויתור
המידע והפרסומים אינם מיועדים להיות, ואינם מהווים, ייעוץ או המלצה פיננסית, השקעתית, מסחרית או מכל סוג אחר המסופקת או מאושרת על ידי TradingView. קרא עוד ב־תנאי השימוש.