OPEN-SOURCE SCRIPT
Moving average of 1-period Percent Change
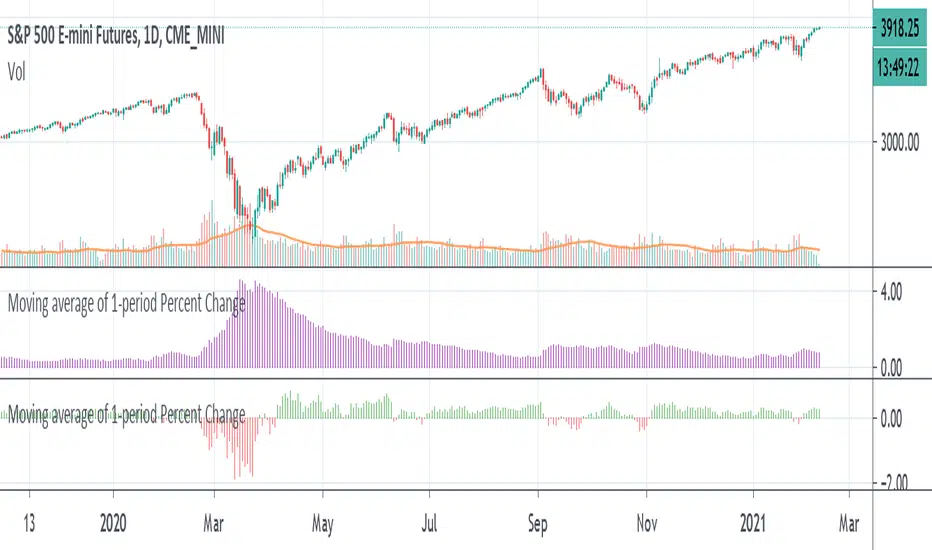
Another way of finding the average range of the bars using 1 period percentage change of the price and taking an average of them. It's given in percentages and the absolute value of the average can be shown when the option is turned on, or the average including the up and down bars can be shown. Perhaps an alternative way of looking at volatility or range of the bars. If you prefer a line version over histogram, just simply change the style under the settings of the indicator.
סקריפט קוד פתוח
ברוח האמיתית של TradingView, יוצר הסקריפט הזה הפך אותו לקוד פתוח, כך שסוחרים יוכלו לעיין בו ולאמת את פעולתו. כל הכבוד למחבר! אמנם ניתן להשתמש בו בחינם, אך זכור כי פרסום חוזר של הקוד כפוף ל־כללי הבית שלנו.
כתב ויתור
המידע והפרסומים אינם מיועדים להיות, ואינם מהווים, ייעוץ או המלצה פיננסית, השקעתית, מסחרית או מכל סוג אחר המסופקת או מאושרת על ידי TradingView. קרא עוד ב־תנאי השימוש.