OPEN-SOURCE SCRIPT
Standard Deviation W/Q/M Pivots
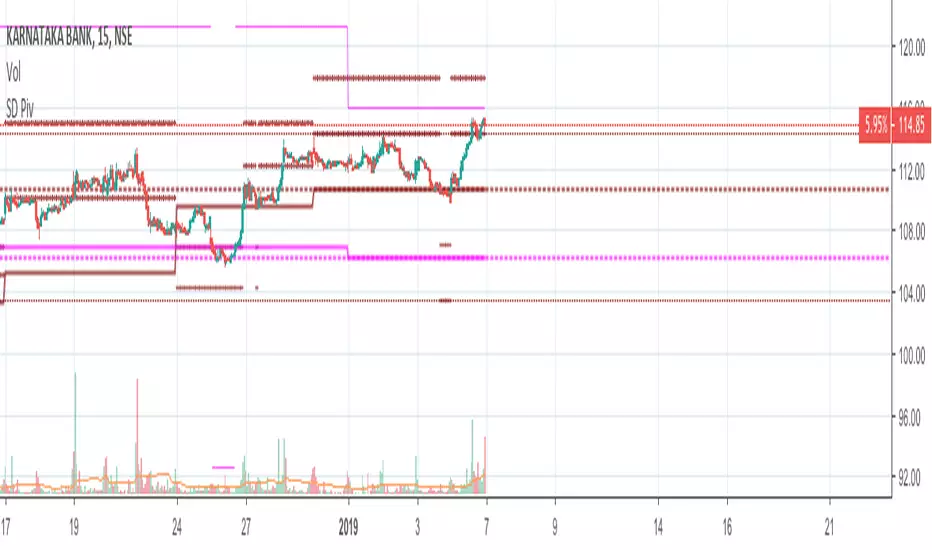
This is a re-iteration of the standard deviation of daily pivots with the pivots applied on weekly, monthly, quarterly and yearly levels. For intraday traders the weekly pivot points will act as a major support resistance levels. Quarterly and monthly pivot points are useful for short-term positions while the yearly pivot determines the stock's long term support-resistance levels and useful in determining if the stock is in a bullish/bearish leg.
סקריפט קוד פתוח
ברוח האמיתית של TradingView, יוצר הסקריפט הזה הפך אותו לקוד פתוח, כך שסוחרים יוכלו לעיין בו ולאמת את פעולתו. כל הכבוד למחבר! אמנם ניתן להשתמש בו בחינם, אך זכור כי פרסום חוזר של הקוד כפוף ל־כללי הבית שלנו.
כתב ויתור
המידע והפרסומים אינם מיועדים להיות, ואינם מהווים, ייעוץ או המלצה פיננסית, השקעתית, מסחרית או מכל סוג אחר המסופקת או מאושרת על ידי TradingView. קרא עוד ב־תנאי השימוש.