OPEN-SOURCE SCRIPT
SMA with Std Dev Bands (Futures/US Stocks RTH)
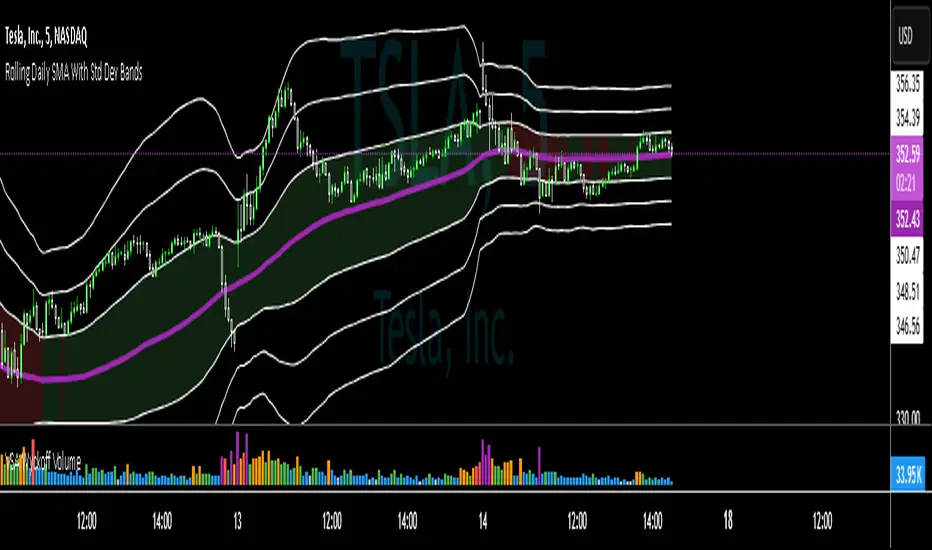
Rolling Daily SMA With Std Dev Bands
Upgrade your technical analysis with Rolling Daily SMA With Std Dev Bands, a powerful indicator that dynamically adjusts to your trading instrument. Whether you’re analyzing futures or US stocks during regular trading hours (RTH), this indicator seamlessly applies the correct logic to calculate a rolling daily Simple Moving Average (SMA) with customizable standard deviation bands for precise trend and volatility tracking.
Key Features:
✅ Automatic Instrument Detection– The indicator automatically recognizes whether you're trading futures or US equities and applies the correct daily lookback period based on your chart’s timeframe.
- Futures: Uses full trading day lengths (e.g., 1380 bars for 1‑minute charts).
- US Stocks (RTH): Uses regular session lengths (e.g., 390 bars for 1‑minute charts).
✅ Rolling Daily SMA (3‑pt Purple Line) – A continuously updated daily moving average, giving you an adaptive trend indicator based on market structure.
✅ Three Standard Deviation Bands (1‑pt White Lines) –
- Customizable multipliers allow you to adjust each band’s width.
- Toggle each band on or off to tailor the indicator to your strategy.
- The inner band area is color-filled: light green when the SMA is rising, light red when falling, helping you quickly identify trend direction.
✅ Works on Any Chart Timeframe – Whether you trade on 1-minute, 3-minute, 5-minute, or 15-minute charts, the indicator adjusts dynamically to provide accurate rolling daily calculations.
# How to Use:
📌 Identify Trends & Volatility Zones – The rolling daily SMA acts as a dynamic trend guide, while the standard deviation bands help spot potential overbought/oversold conditions.
📌 Customize for Precision – Adjust band multipliers and toggle each band on/off to match your trading style.
📌 Trade Smarter – The filled inner band offers instant visual feedback on market momentum, while the outer bands highlight potential breakout zones.
🔹 This is the perfect tool for traders looking to combine trend-following with volatility analysis in an easy-to-use, adaptive indicator.
🚀 Add Rolling Daily SMA With Std Dev Bands to your chart today and enhance your market insights!
---
*Disclaimer: This indicator is for informational and educational purposes only and should not be considered financial advice. Always use proper risk management and conduct your own research before trading.*
סקריפט קוד פתוח
ברוח האמיתית של TradingView, יוצר הסקריפט הזה הפך אותו לקוד פתוח, כך שסוחרים יוכלו לעיין בו ולאמת את פעולתו. כל הכבוד למחבר! אמנם ניתן להשתמש בו בחינם, אך זכור כי פרסום חוזר של הקוד כפוף ל־כללי הבית שלנו.
כתב ויתור
המידע והפרסומים אינם מיועדים להיות, ואינם מהווים, ייעוץ או המלצה פיננסית, השקעתית, מסחרית או מכל סוג אחר המסופקת או מאושרת על ידי TradingView. קרא עוד ב־תנאי השימוש.