OPEN-SOURCE SCRIPT
Floor and Roof Indicator

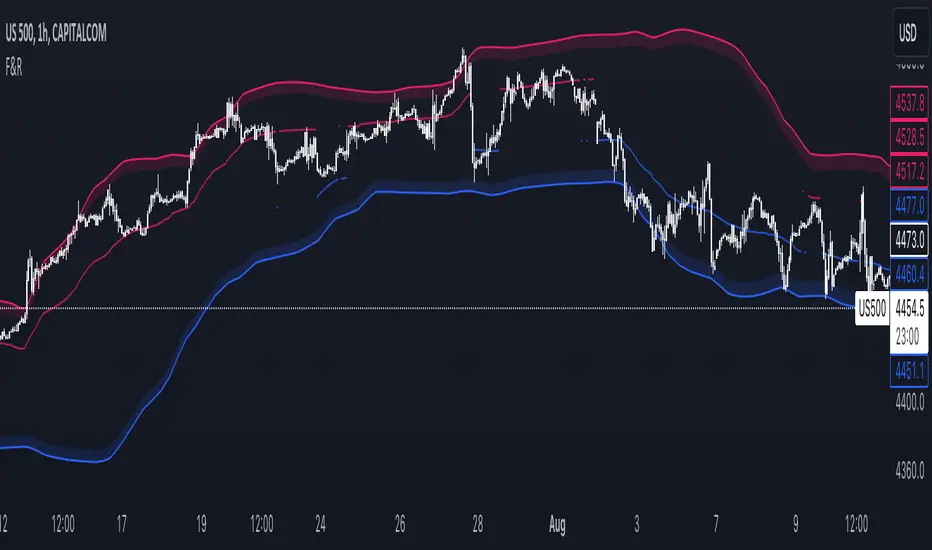
The Floor and Roof indicator is a tool developed to help traders identify potential areas of support and resistance both for trend following and for mean reversal trading decisions.
The indicator plots the "Roof" which is the main level of resistance, and the "Floor" which is the main level of support. These lines are calculated on the "Lenght" parameter and smoothed by the "Smooth" parameter, and they use both the volatility and the main market structure as calculation methods.
Additionally, this indicator plots an area that can be modified by the "Zone width" parameter and two other lines, called "Second floor" and "Second roof" respectively, which are plotted only whenever they are significant to the price current level.
This indicator can be used in several ways:
- In a clear trend, you could wait for a break of the second floor or roof as an indication of a change in the market direction
- As the price goes out of the reversal zones, this can be an indication of a reversal
- In a clear trend, you can wait for the price to bounce on the second floor or roof lines to enter a trade
סקריפט קוד פתוח
ברוח האמיתית של TradingView, יוצר הסקריפט הזה הפך אותו לקוד פתוח, כך שסוחרים יוכלו לעיין בו ולאמת את פעולתו. כל הכבוד למחבר! אמנם ניתן להשתמש בו בחינם, אך זכור כי פרסום חוזר של הקוד כפוף ל־כללי הבית שלנו.
כתב ויתור
המידע והפרסומים אינם מיועדים להיות, ואינם מהווים, ייעוץ או המלצה פיננסית, השקעתית, מסחרית או מכל סוג אחר המסופקת או מאושרת על ידי TradingView. קרא עוד ב־תנאי השימוש.