OPEN-SOURCE SCRIPT
Multi-timeframe Harmonic Patterns

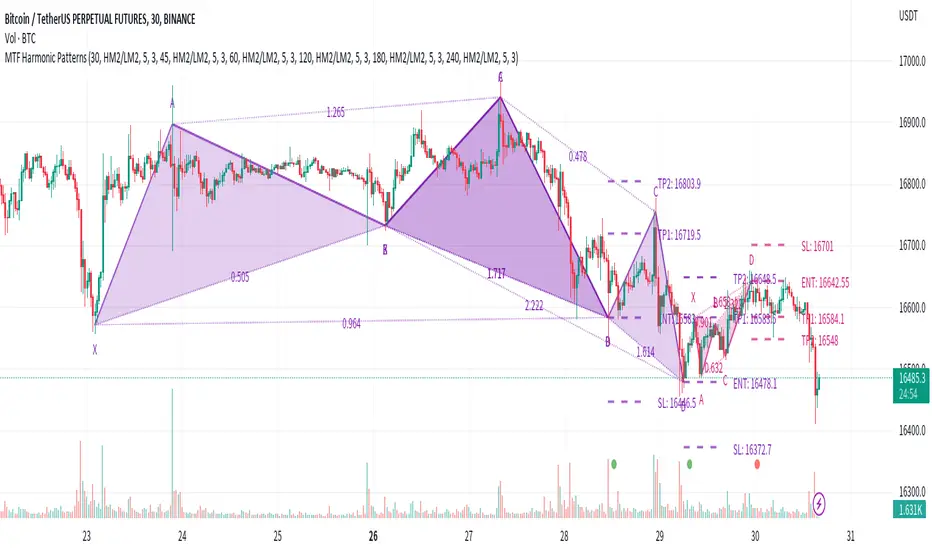
Hello friends. In recent months I have been busy with my academic research and haven't had much time to publish new scripts. To fill the gap of these months, I decided to publish the indicator Multi-timeframe Harmonic Patterns. Harmonic technical chart patterns can predict the next price trend and provide traders with clues to the price direction, which is one of the indicators widely used by professional traders.
(1) Indicator description
(2) Key parameters
(3) Supported Patterns:
————————————————————————————————————————
各位朋友大家好。最近几个月我忙于自己的学术研究没有过多时间更新脚本。为弥补这几个月的空缺,我决定发布该多时间周期的谐波指标。谐波技术图表形态在一定程度上可以预测下一个价格走势,为交易者提供价格方向的线索,是广大专业交易人员广泛使用的指标之一。
(1) 指标说明
(2) 关键参数
(3) 支持形态:
(1) Indicator description
- This indicator is built on ZigZag Multi Time Frame with Fibonacci RetracementLonesomeTheBlue . Thanks to LonesomeTheBlue for contributing the awesome indicator
- The indicator supports 6 different timeframes, and 25 different harmonic patterns
- This indicator supports indicating key indicator prices: entry price, stop loss price, and two take profit prices
(2) Key parameters
- timeframe resolution: The timeframe of the harmonic pattern
- pivot high/low source: Calculation method of high/low pivot points
- timeframe pivot period: Minimum period of high/low pivot points
- delay for confirmations: Wait for N candles to confirm the chart pattern
- bullish/bearish colors: Bullish/bearish pattern colors
- enable harmonic patterns: Enable current harmonic patterns
- show harmonic patterns: Show harmonic patterns found
- show trading prices of patterns: Show key prices of harmonic patterns
(3) Supported Patterns:
- Gartlay
- Cypher
- Bat
- Deepcrab
- Crab
- Butterfly
- Shark
- 0-5
- AB=CD
- 3-Drives
- Anti-Gartlay
- Anti-Cypher
- Anti-Bat
- Anti-Crab
- Anti-Butterfly
- Anti-Shark
- Black-Swan
- White-Swan
- Descending-Triangle
- Ascending-Triangle
- Symmetrical-Triangle
- Headers&Shoulders
- Inverse-Headers&Shoulders
- Double-Top
- Double-Bottom
————————————————————————————————————————
各位朋友大家好。最近几个月我忙于自己的学术研究没有过多时间更新脚本。为弥补这几个月的空缺,我决定发布该多时间周期的谐波指标。谐波技术图表形态在一定程度上可以预测下一个价格走势,为交易者提供价格方向的线索,是广大专业交易人员广泛使用的指标之一。
(1) 指标说明
- 该指标建立于 ZigZag Multi Time Frame with Fibonacci RetracementLonesomeTheBlue ,感谢LonesomeTheBlue贡献的出色指标
- 该指标支持6种不同的时间周期,以及25种不同的谐波形态
- 该指标支持指示关键的指标价格:入场价格、止损价格、以及两种止盈价格
(2) 关键参数
- timeframe resolution: 谐波形态的时间周期
- pivot high/low source: 高/低枢纽点的计算方式
- timeframe pivot period: 高/低枢纽点的最小周期
- delay for confirmations: 等待N个蜡烛以确认图表形态
- bullish/bearish colors: 看涨/看跌的形态颜色
- enable harmonic patterns: 使能当前的谐波形态
- show harmonic patterns: 显示被发现的谐波形态
- show trading prices of patterns: 显示谐波形态的关键价格
(3) 支持形态:
- Gartlay
- Cypher
- Bat
- Deepcrab
- Crab
- Butterfly
- Shark
- 0-5
- AB=CD
- 3-Drives
- Anti-Gartlay
- Anti-Cypher
- Anti-Bat
- Anti-Crab
- Anti-Butterfly
- Anti-Shark
- Black-Swan
- White-Swan
- Descending-Triangle
- Ascending-Triangle
- Symmetrical-Triangle
- Headers&Shoulders
- Inverse-Headers&Shoulders
- Double-Top
- Double-Bottom
סקריפט קוד פתוח
ברוח האמיתית של TradingView, יוצר הסקריפט הזה הפך אותו לקוד פתוח, כך שסוחרים יוכלו לעיין בו ולאמת את פעולתו. כל הכבוד למחבר! אמנם ניתן להשתמש בו בחינם, אך זכור כי פרסום חוזר של הקוד כפוף ל־כללי הבית שלנו.
כתב ויתור
המידע והפרסומים אינם מיועדים להיות, ואינם מהווים, ייעוץ או המלצה פיננסית, השקעתית, מסחרית או מכל סוג אחר המסופקת או מאושרת על ידי TradingView. קרא עוד ב־תנאי השימוש.