OPEN-SOURCE SCRIPT
מעודכן Collective Indicator

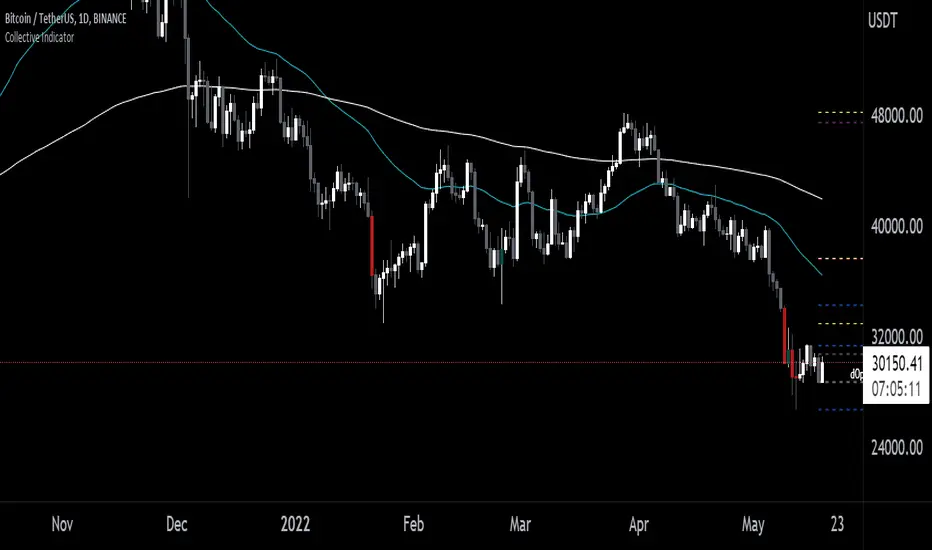
Key notes are that this indicators markets the High and Low of the previous day, week month and quarter. It also marks the open of the day, week, month and quarter. These are levels that can be important areas to take trades towards and away from.
It includes additional features some may wish to use that I've included for your convenience that I don't personally use anymore. This is the 50 and 200 EMAs and high volume candle coloring. EMAs can be helpful for identifying the average markup and markdown of a a trend on any given timeframe. Be careful with mean reversion strategies alone since they tend not to have great entries and could result in high losses if used in isolation.
The "Length" and "High Volume" settings control how the coloration of candles is applied. Length is the amount of bars it will use to calculate a volume average. "High Volume" is the multiplier used to distinguish how much additional volume you want to be considered "high" volume. 1x meaning average 2x meaning double volume and etc.
High volume identification can help show distributive or accumulative characteristics around key areas.
I personally focus on the Open, Low, High close data, apply SMC concepts and Wyckoff concepts to look for trades around these key areas.
הערות שחרור
added 5/13 ema optionsסקריפט קוד פתוח
ברוח האמיתית של TradingView, יוצר הסקריפט הזה הפך אותו לקוד פתוח, כך שסוחרים יוכלו לעיין בו ולאמת את פעולתו. כל הכבוד למחבר! אמנם ניתן להשתמש בו בחינם, אך זכור כי פרסום חוזר של הקוד כפוף ל־כללי הבית שלנו.
כתב ויתור
המידע והפרסומים אינם מיועדים להיות, ואינם מהווים, ייעוץ או המלצה פיננסית, השקעתית, מסחרית או מכל סוג אחר המסופקת או מאושרת על ידי TradingView. קרא עוד ב־תנאי השימוש.
סקריפט קוד פתוח
ברוח האמיתית של TradingView, יוצר הסקריפט הזה הפך אותו לקוד פתוח, כך שסוחרים יוכלו לעיין בו ולאמת את פעולתו. כל הכבוד למחבר! אמנם ניתן להשתמש בו בחינם, אך זכור כי פרסום חוזר של הקוד כפוף ל־כללי הבית שלנו.
כתב ויתור
המידע והפרסומים אינם מיועדים להיות, ואינם מהווים, ייעוץ או המלצה פיננסית, השקעתית, מסחרית או מכל סוג אחר המסופקת או מאושרת על ידי TradingView. קרא עוד ב־תנאי השימוש.